

ELECTION 2026 RESOURCES
👟 Find your match on Council with SimCouncillor
⛳️ Browse Council’s Lobbying Report Cards
📽️ View City Hall Watcher’s Election Projection
📊 Search the Council Scorecard
There are 21 days left until Election Day.
And for a lot of people, there’s less than that. Early voting kicks off tomorrow, October 6, and runs through October 11. In past elections, Toronto voters have enjoyed voting early. About one in five voters cast their ballot at early polls or by mail in the 2023 by-election.
If the same early enthusiasm holds, by this time next week the election will already be over for a large chunk of the city.
So now seems like a really good time to look at where things stand. In this issue, I’ve brought back Alex Olson to tell us about what City Hall Watcher’s projection site thinks about the mayoral race, and how it might move over the next 21 very important days.
Also: it’s a new month, so I’ve got LOBBYIST WATCH, featuring notes on garbage trains, a plan to put people to work on farms, and more.
And CANDIDATE CHAOS rolls on, with endorsements from characters both real and fictional.
Wait, there’s more: notes on Bloor Street bike counts, the property tax hike Brad Bradford intends to keep, and a visual look at Toronto’s past elections.
Let’s get into it.
✨ It’s election season. This issue runs long. If it gets cut off in your email client, read it on the web.
— Matt Elliott
matt@cityhallwatcher.com / Archives / Subscribe
Poll positions: where the mayoral race stands — and how it might change
By Alex Olson
Despite occasional headlines to the contrary, this has been a mayoral race with remarkably unshifting opinions. Polls have stayed within a few points of each other, with no clear trend one way or the other.
Our model reflects this, showing a slow-but-steady increase in Mayor Olivia Chow’s chances of winning from around 70% on August 25 to about 75% now. That increase is caused primarily by two factors: first, the number of polls showing more or less the same thing increases our model’s confidence that this is basically what will happen. Second, Councillor Brad Bradford is running out of time to shift public opinion, and he needs it to shift a lot in order to win.
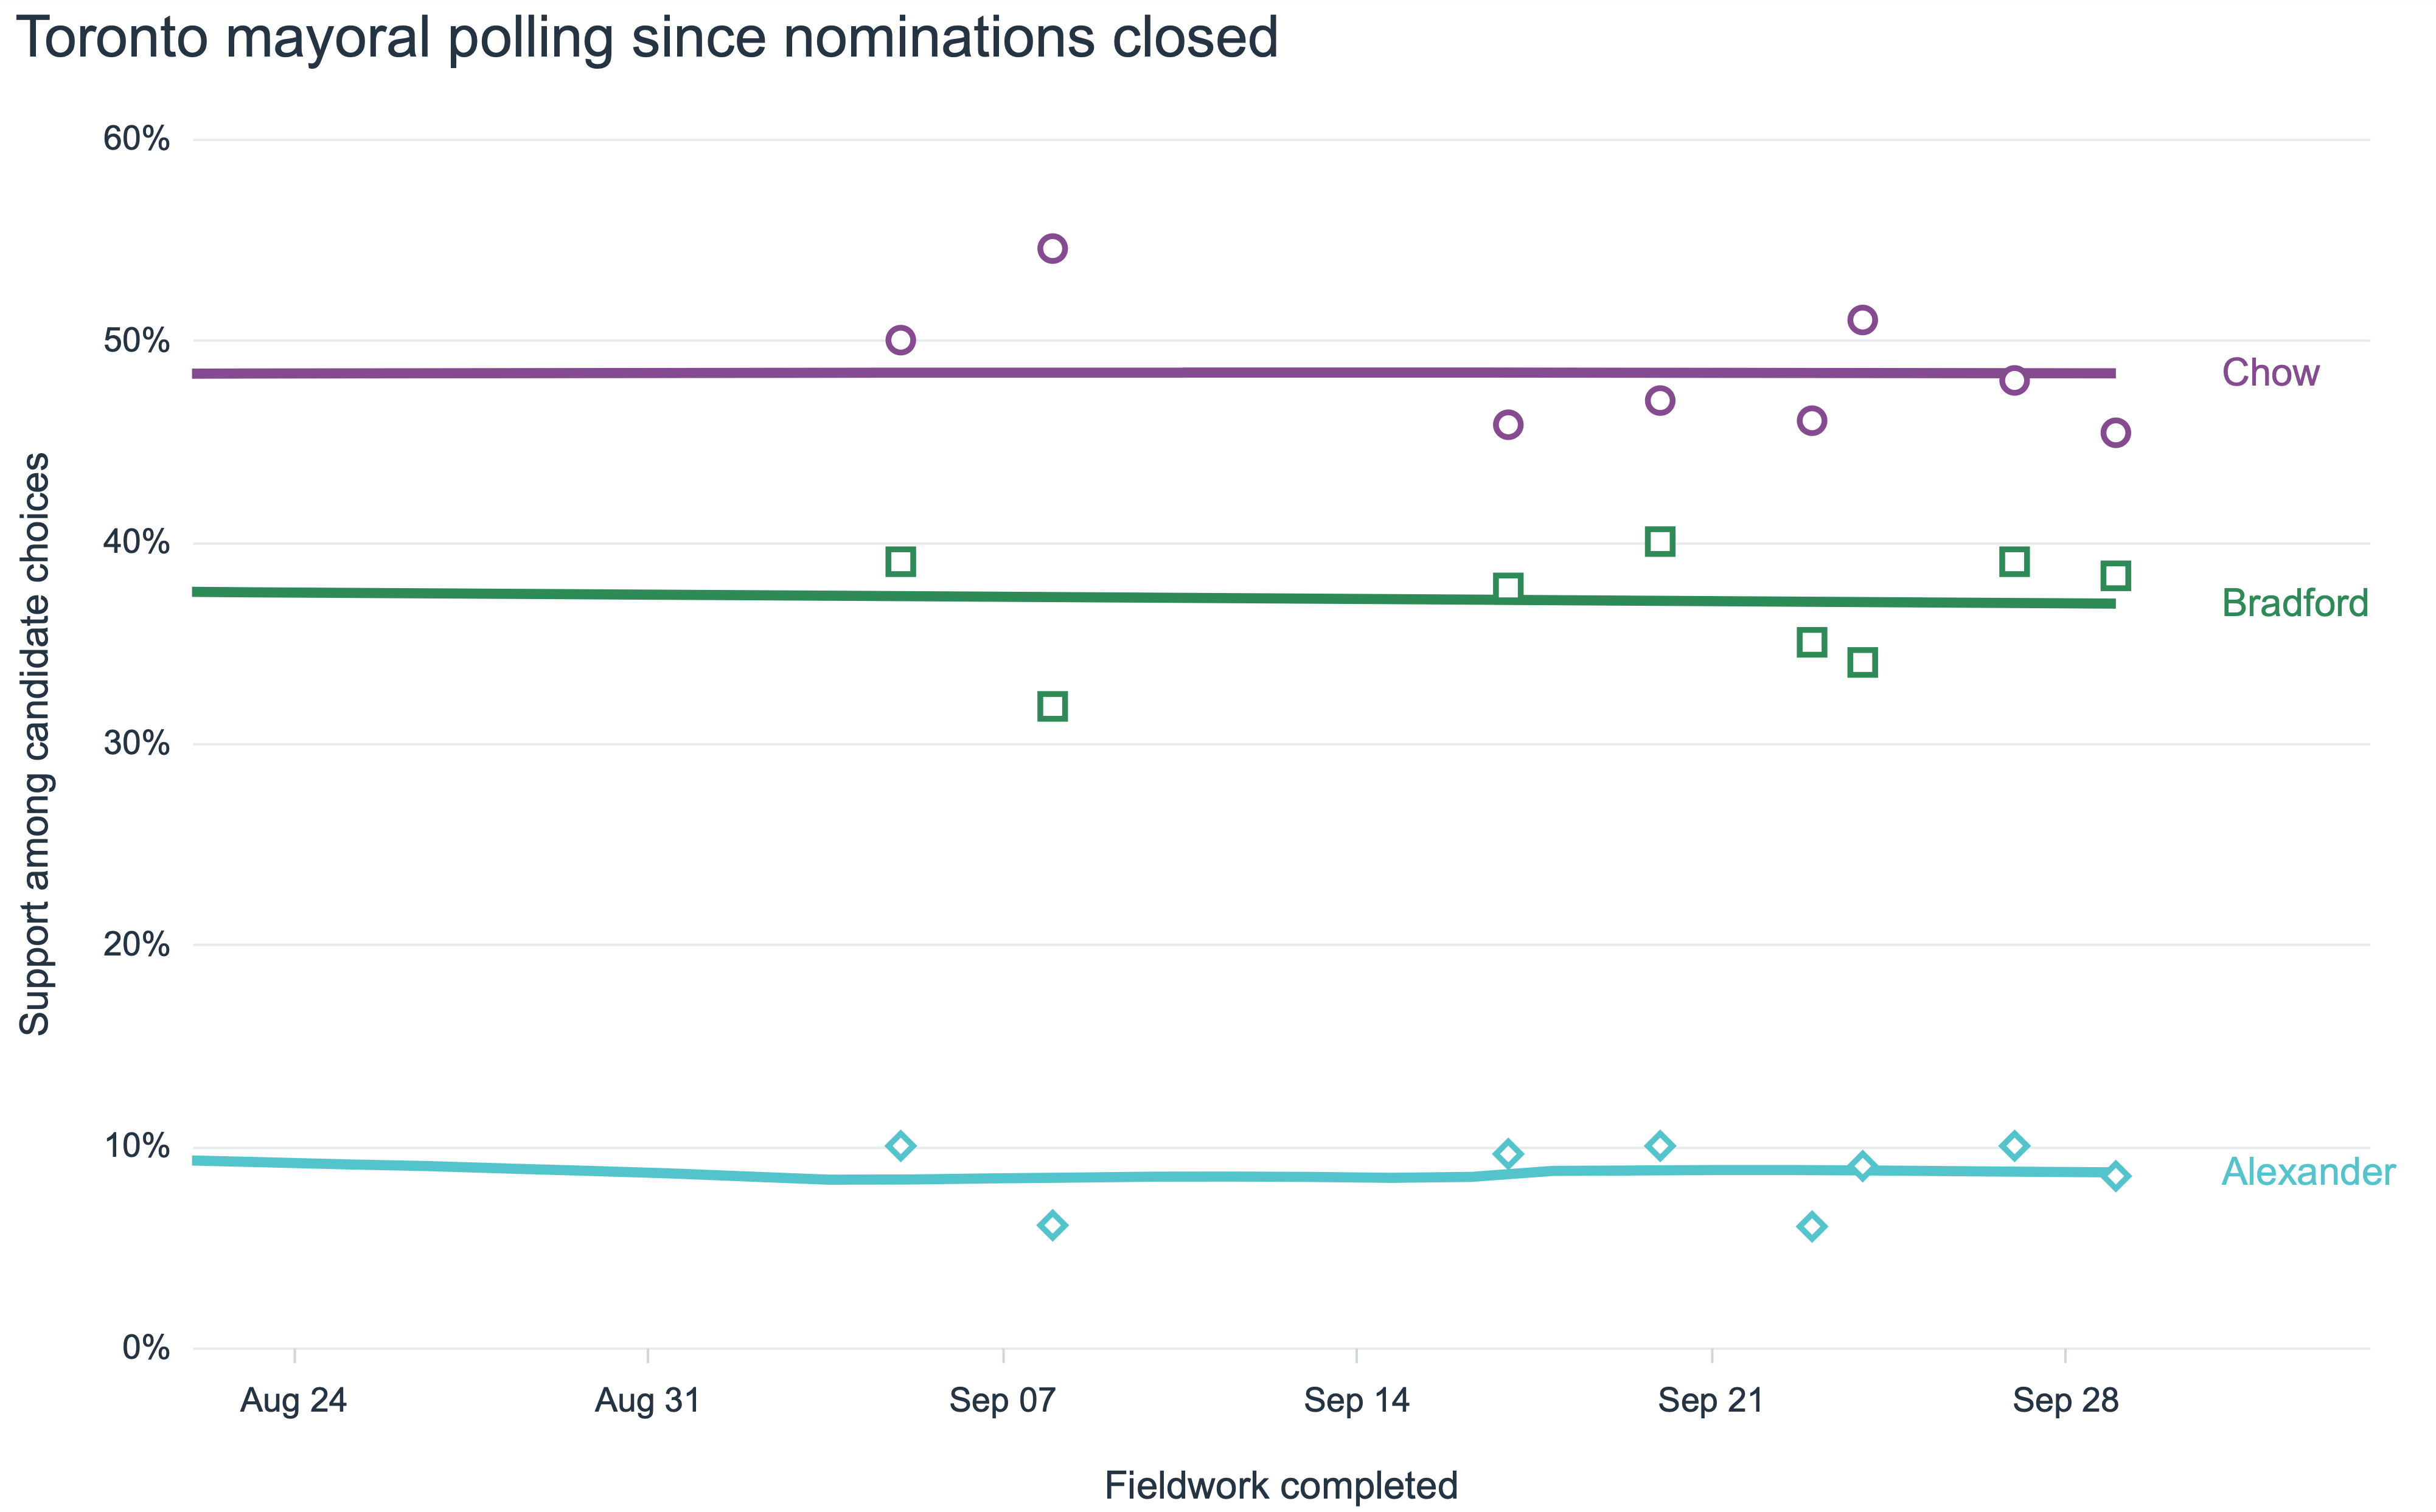
In spite of this, our model is still giving Bradford about a one-in-four chance of winning the election. To understand why, let’s take a look at some of the scenarios that might swing things yet.
What if Bradford gets a big endorsement?
In 2023, in the final weeks of the by-election, Ana Bailão jumped from third in polling to a close contender to Chow. One big reason for this was a raft of high-profile endorsements late in the day. Most notably, after promising to stay out of the race, John Tory endorsed Bailão with only a few days to go. This time Tory has again signalled his intention to keep out of the race, which leads many to wonder whether he will ultimately make an endorsement.
For an endorsement to make a difference, support needs to come from somewhere. In 2023, the field of candidates was especially fragmented.
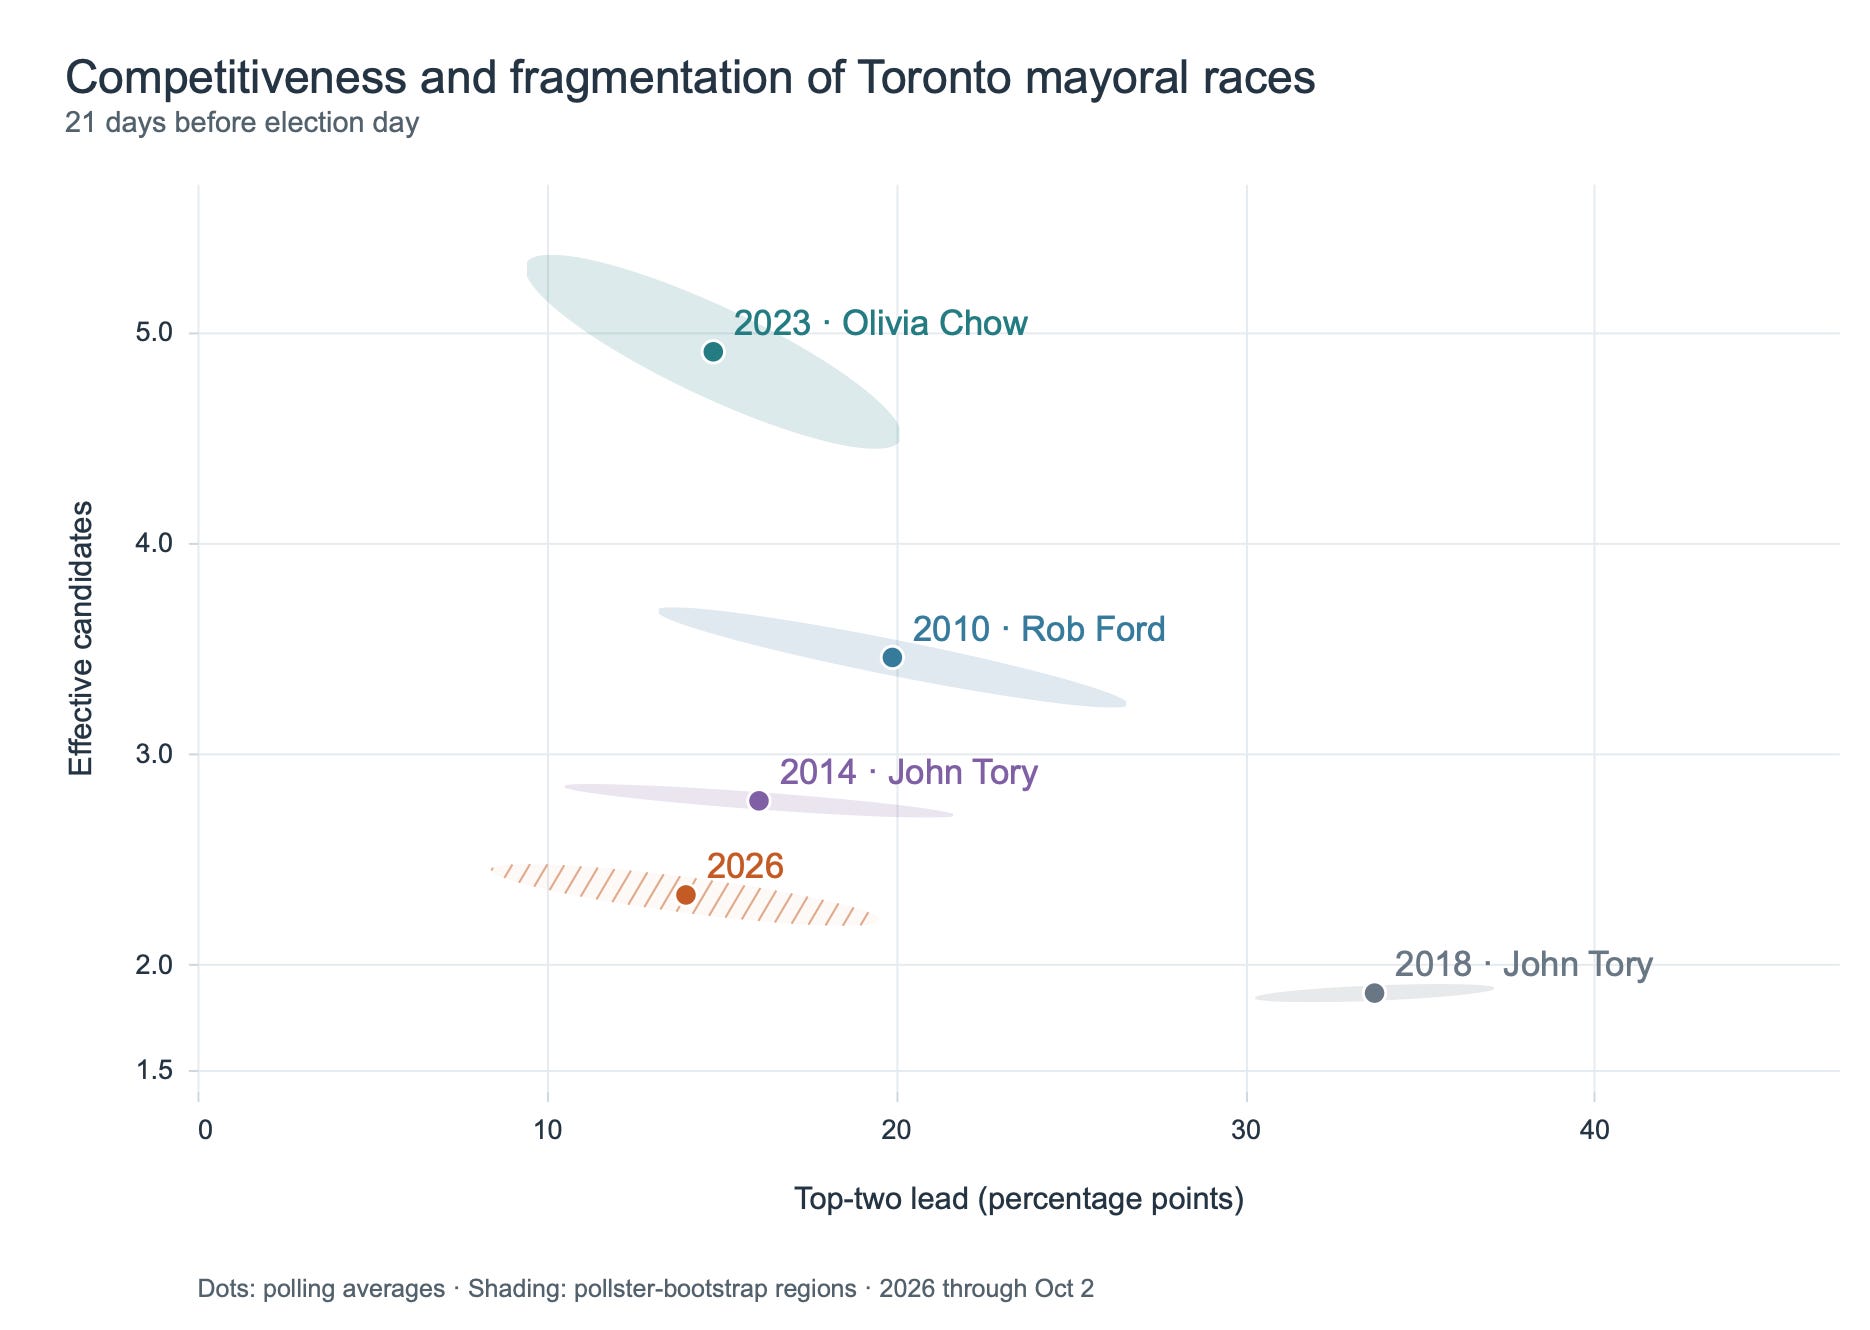
For this analysis, I’ve looked at the four past mayoral elections where there were at least three polls, from at least three pollsters, in the last three weeks before the election. Along the bottom axis of this chart is the gap between the winner and the second-place candidate in terms of vote share in polling (so further to the left means a smaller lead); along the side is the number of “effective candidates”, which you can think of as representing how many genuine challengers each race saw.
What we can see is that the 2026 race is pretty normal in terms of the gap between the top two candidates, but on the lower end in terms of the effective number of candidates. On the other hand, 2023 is also normally competitive, but on the extreme end of fragmentation. This meant that there were many other candidates for Bailão to pull support from in the final days, which is exactly what polling from that election shows:
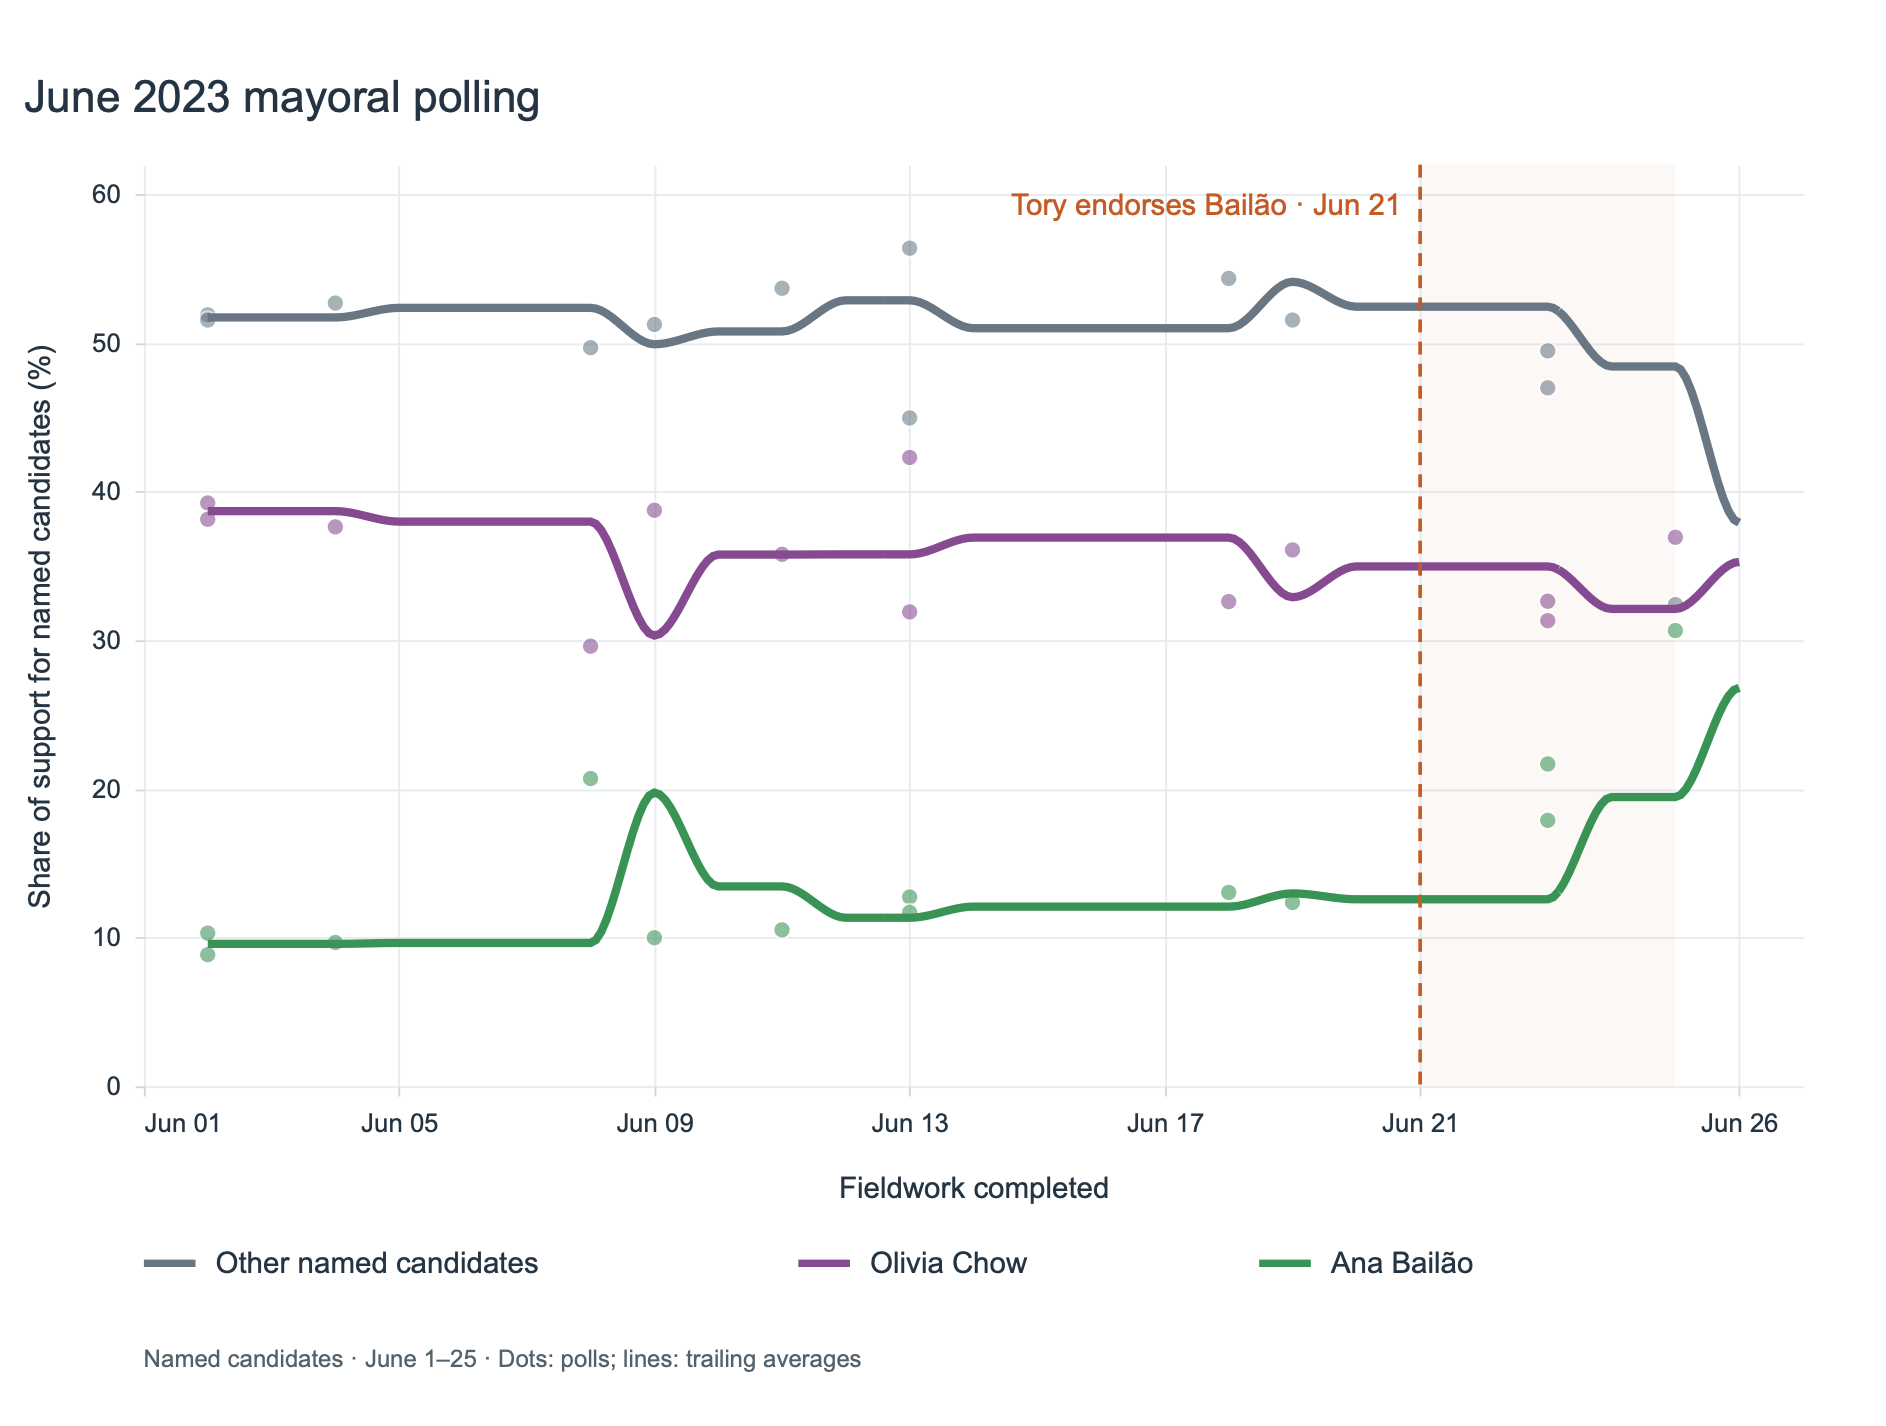
Post-Tory endorsement, Chow’s support rate remained largely constant, while Bailão jumped at the cost of the many other candidates in the race. Unfortunately for Bradford, this time around the race is already largely consolidated. In the final week of polling, Bailão’s gain was equivalent to about a quarter of the support held by other candidates at the start of that week. The same gain from today’s much smaller pool would give Bradford only about 2.6 points, leaving him still behind Chow.
What if Alexander drops out?
As the field of candidates is finalized, nobody currently on the ballot can “drop out” and have their name removed. However, Chris Alexander could still announce he does not want to be mayor and ask that the electorate vote for someone else.
Luckily for us, Mainstreet Research included a version of this question in last week’s poll. They included a forced choice between Bradford and Chow, letting us see exactly what might happen if Alexander changes his mind.
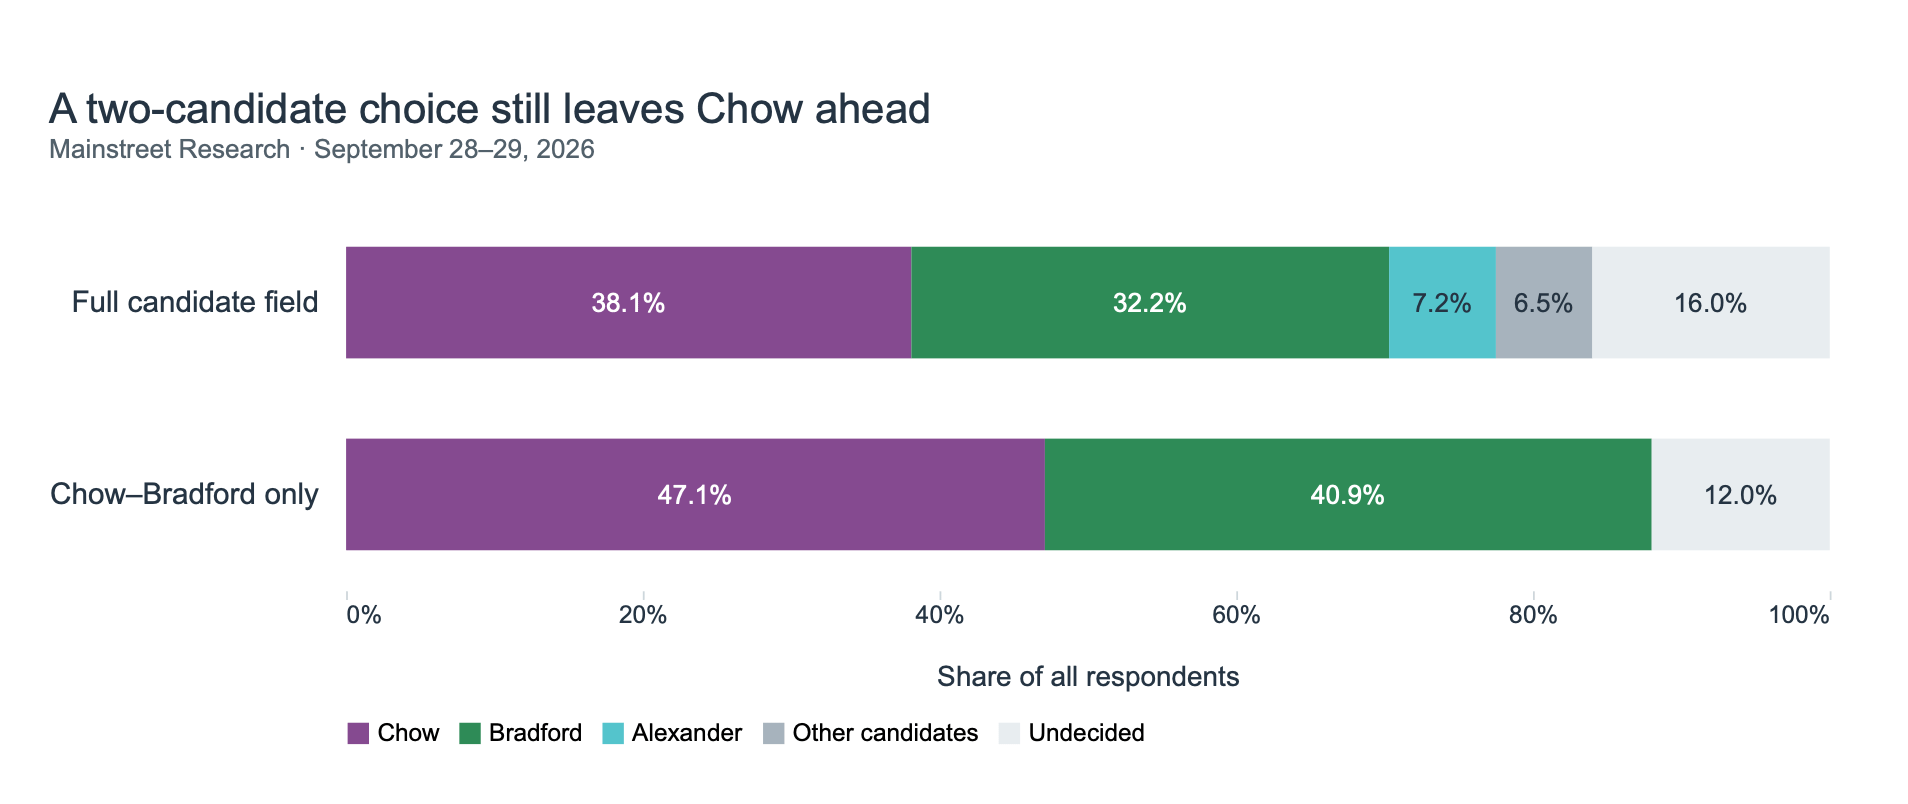
Interestingly, this seems to hardly affect the race at all. Chow rises about nine points, and so does Bradford.
So what would it take for our model to see Bradford as equivalently competitive to Chow? I ran three scenarios to explore what it would take for Bradford and Chow to have about even chances of winning, depending on how dramatic the shift in polling would need to be (and how many polls would need to show it):
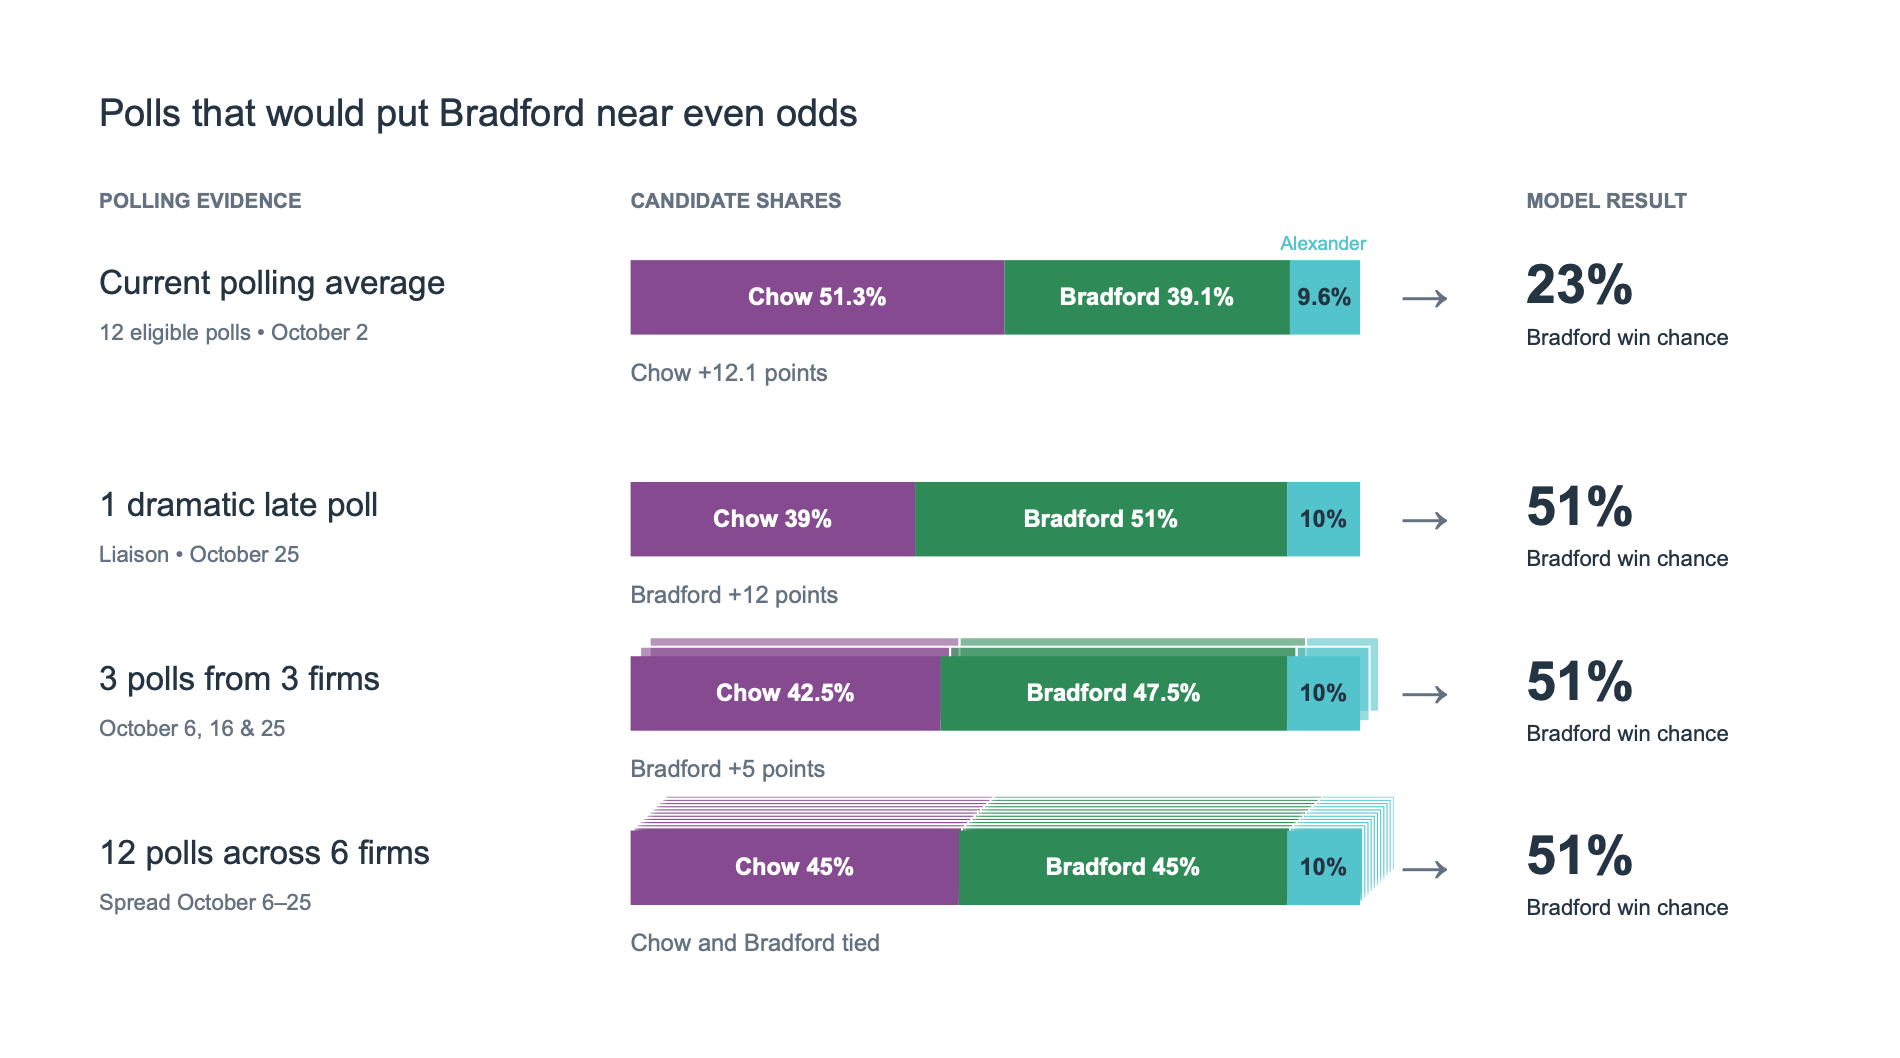
A single bombshell poll showing the lead completely flipped would effectively double Bradford’s chances, but would not be enough to consider him the presumptive winner. This makes sense — that poll would be flying in the face of all previous evidence, and we would take it seriously but with some caution. More plausible would be a small number of strong polling leads — three polls showing Bradford up five points (still a seventeen-point swing from today!) or twelve polls showing a tied race would be enough. None of these scenarios seem particularly likely given the consistency of polling we have observed, however.
My view today is that on the eve of this election, our model will likely give Brad Bradford between a 20 and 25% chance of winning. This is not an insignificant chance, by any means, and it’s always important to remember the limitations of this exercise — on the night of the 2016 US presidential election, the New York Times gave Donald Trump a 15% chance of winning. It was unlikely, but unlikely is very different from impossible.
What about those ward-level polls?
A quick note on the five ward-level polls Forum Research released. In 2022, Forum published six ward-level polls, which often badly misstated the size of the lead (though all six poll leaders did win):
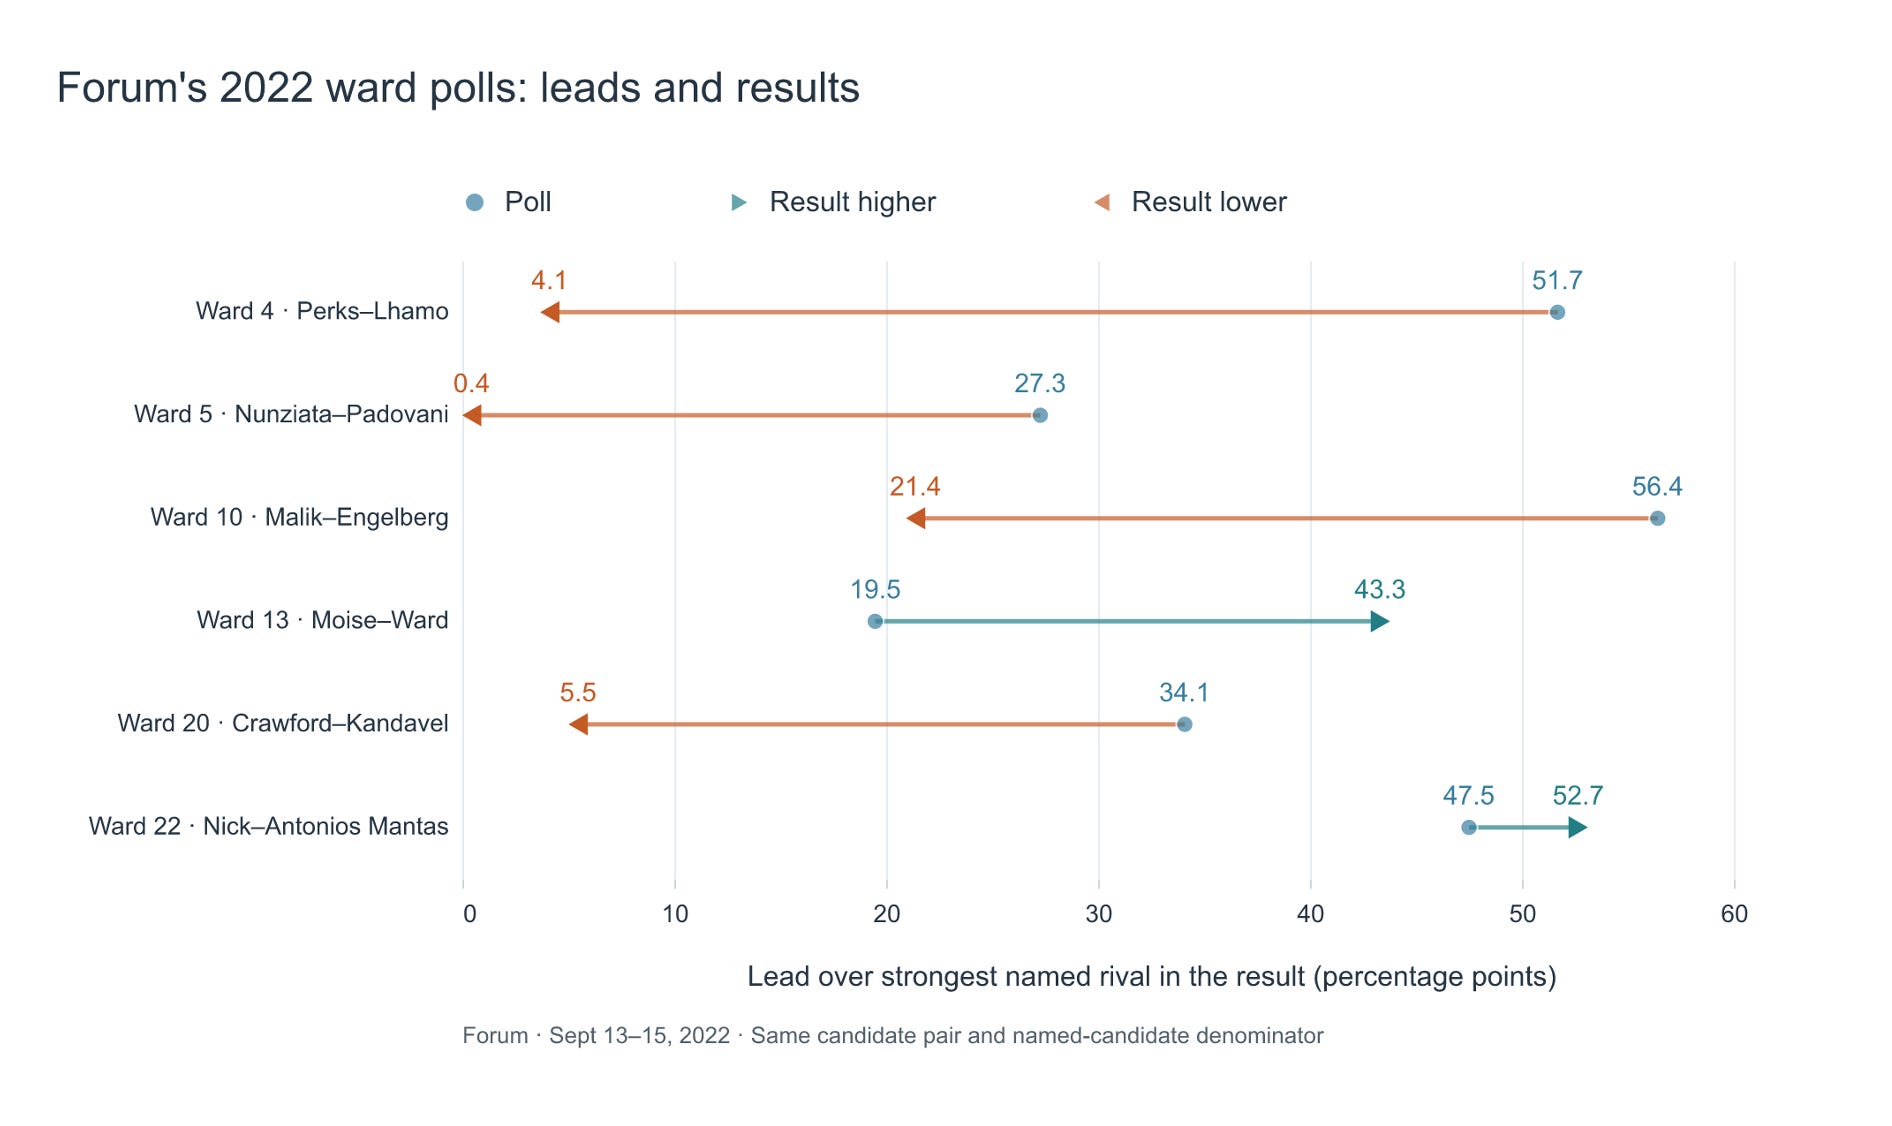
There isn’t enough historical data to properly model the results for the five wards from this year’s polling, but we can use the average-case and worst-case error from the 2022 polling to get a sense of the range in which results may land.
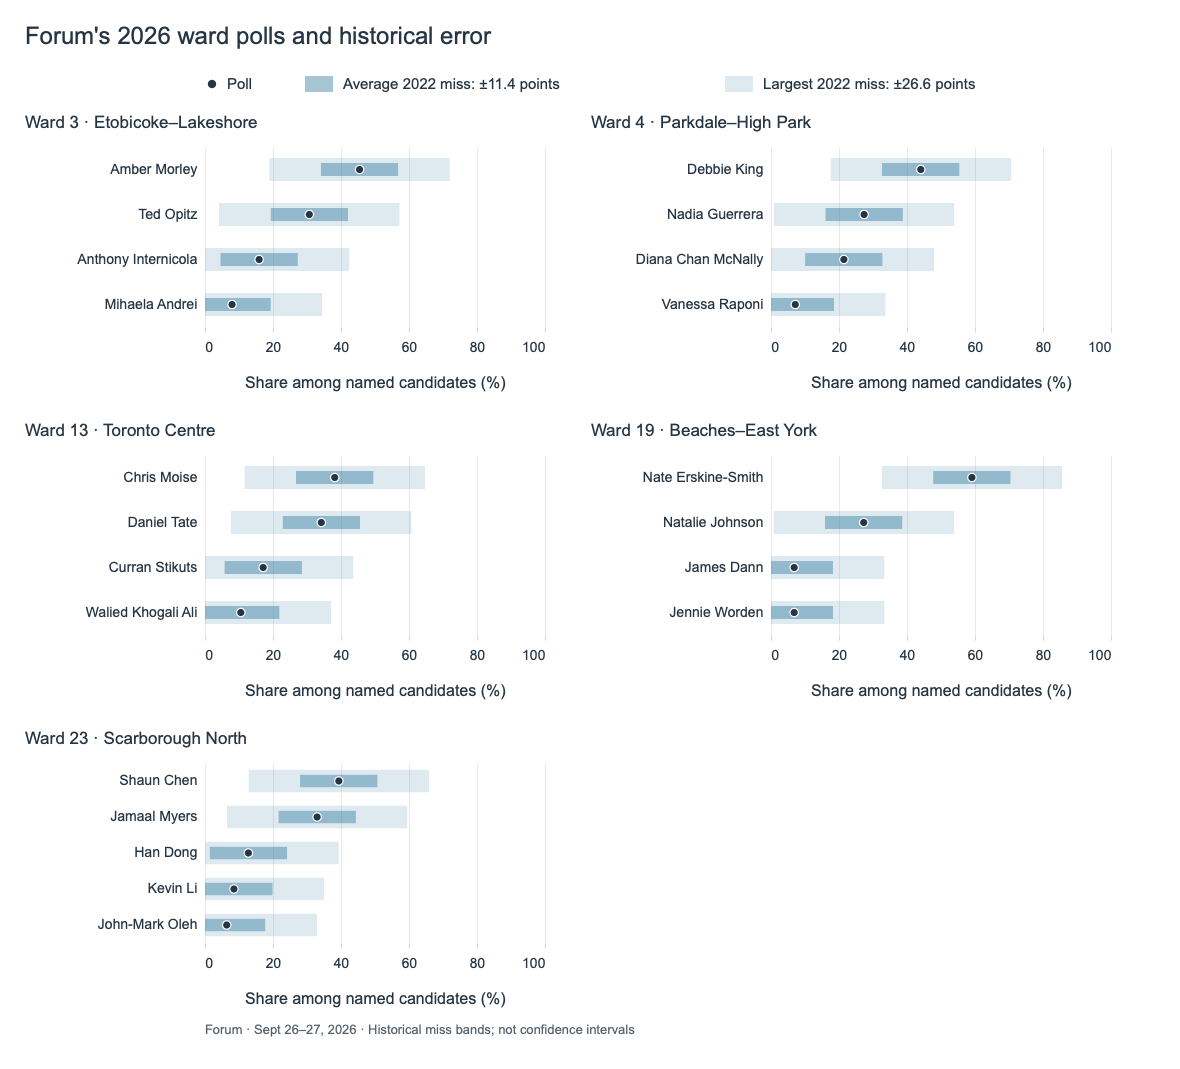
Out of the five, Beaches-East York shows the most commanding lead — however, even here the error bar is wide enough that the outcome is far from certain. Whatever ward you live in, don’t forget that early voting starts tomorrow, October 6 — and definitely don’t miss Kids Vote Weekend on October 10 and 11!
Alex Olson is the Director of UofT’s Centre for Analytics & AI Engineering, where he leads applied research, education and partnerships around AI. He helps people assess where AI can safely contribute, as well as to understand its limitations and risks. Alex has worked with climate scientists, surgeons and air quality researchers to reliably and accurately answer questions that require sophisticated modelling.
City Hall Watcher’s Election Projection site is a free resource, but you can show your support — and get access to the rest of this issue — by becoming a paid subscriber. You’ll also be supporting local indie journalism.
Lobbyist Watch for September 2026: All aboard the garbage train, broke billionaire farms, and more

Lobbyist Watch is City Hall Watcher’s monthly summary of activity on Toronto City Hall’s Lobbyist Registry. In September 2026, City Hall Watcher reviewed 265 registered lobbyist communications and 50 new subject matter registrations.
Disclaimer: Toronto’s Lobbyist Registry requires lobbyists to register and record all communications they have with politicians and staff, but it does not require them to provide much detail about the extent of those communications. As a result, a meeting noted below could be a long conversation with some deal-making or a passing chat of no real consequence. The data presented below is current as of October 5, 2026.
Trash train
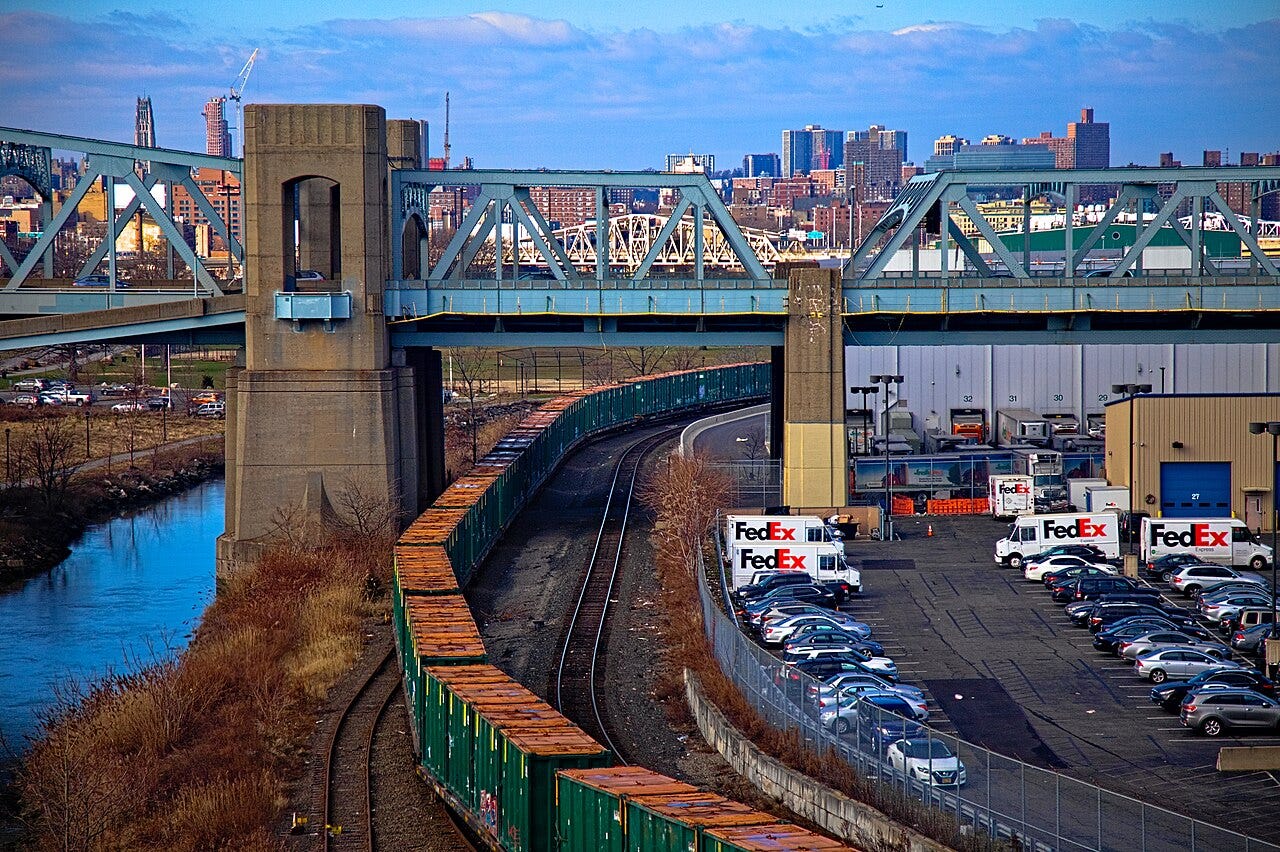
CN Rail has registered to talk to City Hall about garbage transit. But not in the way people usually talk to City Hall about garbage transit. In this case, CN wants to extol the virtues of shipping trash out of Toronto by rail.

.jpg)