

It’s the dawn of a new term. At the stroke of midnight last Saturday night, City Hall said goodbye to the last four years and hello to the next four. The official Council roster on the City’s website has been updated. It’s a brave new world.
Still, there’s good reason to think about how exactly we got here, so I’ve brought some special guests.
Isaac Berman, who you might know from his very helpful Observing the City website and social media accounts, makes his City Hall Watcher debut with a detailed look at how Mayor Olivia Chow saw an electoral benefit due to the strong support of people who live in high-rise towers — and how the move to build more dense developments around transit stations might help progressive politicians in coming elections.
After that, Alex Olson, the architect of City Hall Watcher’s Election Projection, is back with a look at how the projection did. Not too shabby, I think.
Finally, I’ve got a look at the committees councillors said they were interested in. I also name Council’s biggest keener. See if you can guess.
✨ This is a jam-packed issue, so it runs a bit long. If it gets cut off in your email client, read it on the web.
— Matt Elliott
matt@cityhallwatcher.com / Archives / Subscribe
The towering divide: how density helped Olivia Chow win re-election
By Isaac Berman
When discussing political divisions at City Hall, much is often made of the downtown versus suburban divide. It is framed this way both in the Council chamber when debating motions, and outside of it by the media during election season while discussing potential winning coalitions. Councillors outside of Old Toronto wards often frame their constituents as having different needs and desires than those downtown. However true this may be, the constituents in “suburban” wards are not a monolith.
An analysis of the poll-by-poll results from the 2026 election shows instead that there was a stark divide between residents within wards outside the downtown core. This divergence may be a result of Toronto’s zoning policies, and could be set to only be exacerbated further in the future.
Fighting with the yellow belt
Much of the new development in Toronto outside of the core has been forced into specific “tower corridors,” due to restrictive zoning policies.
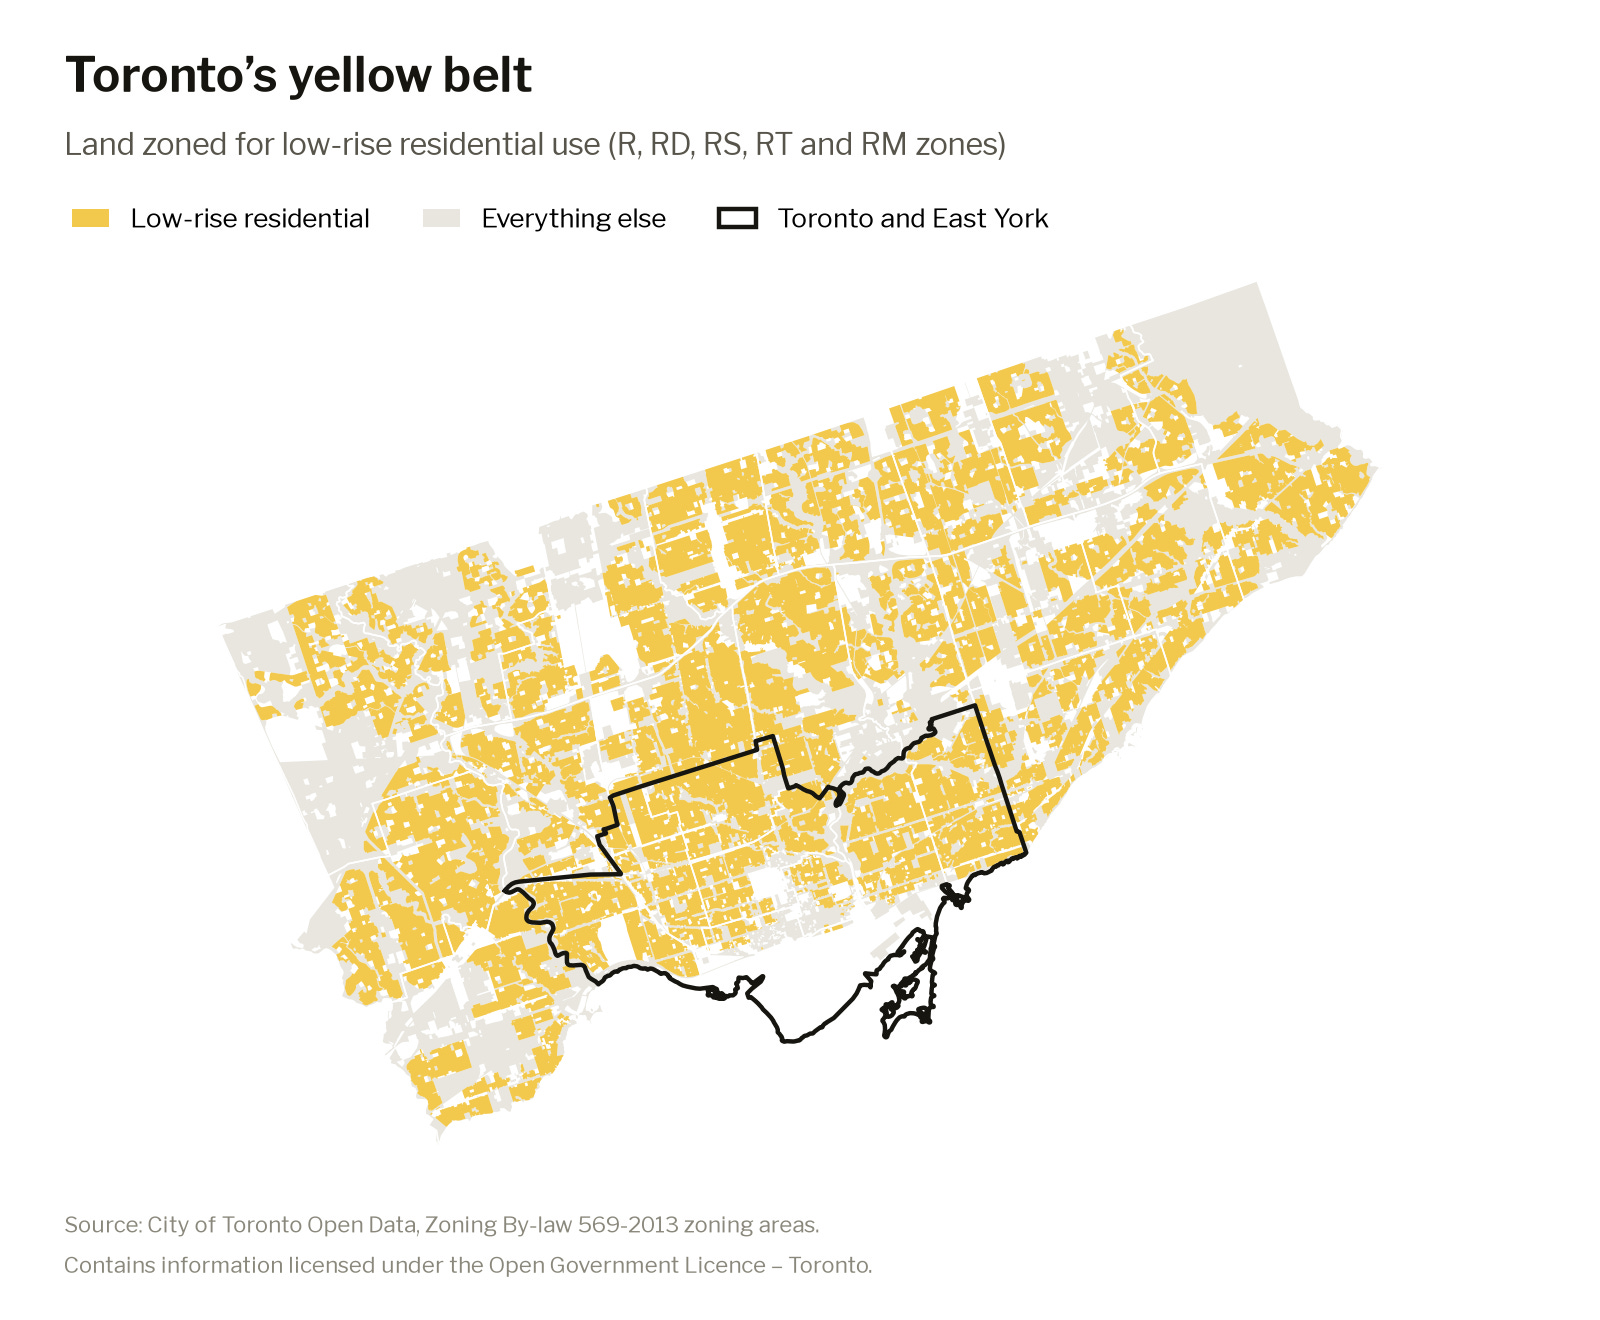
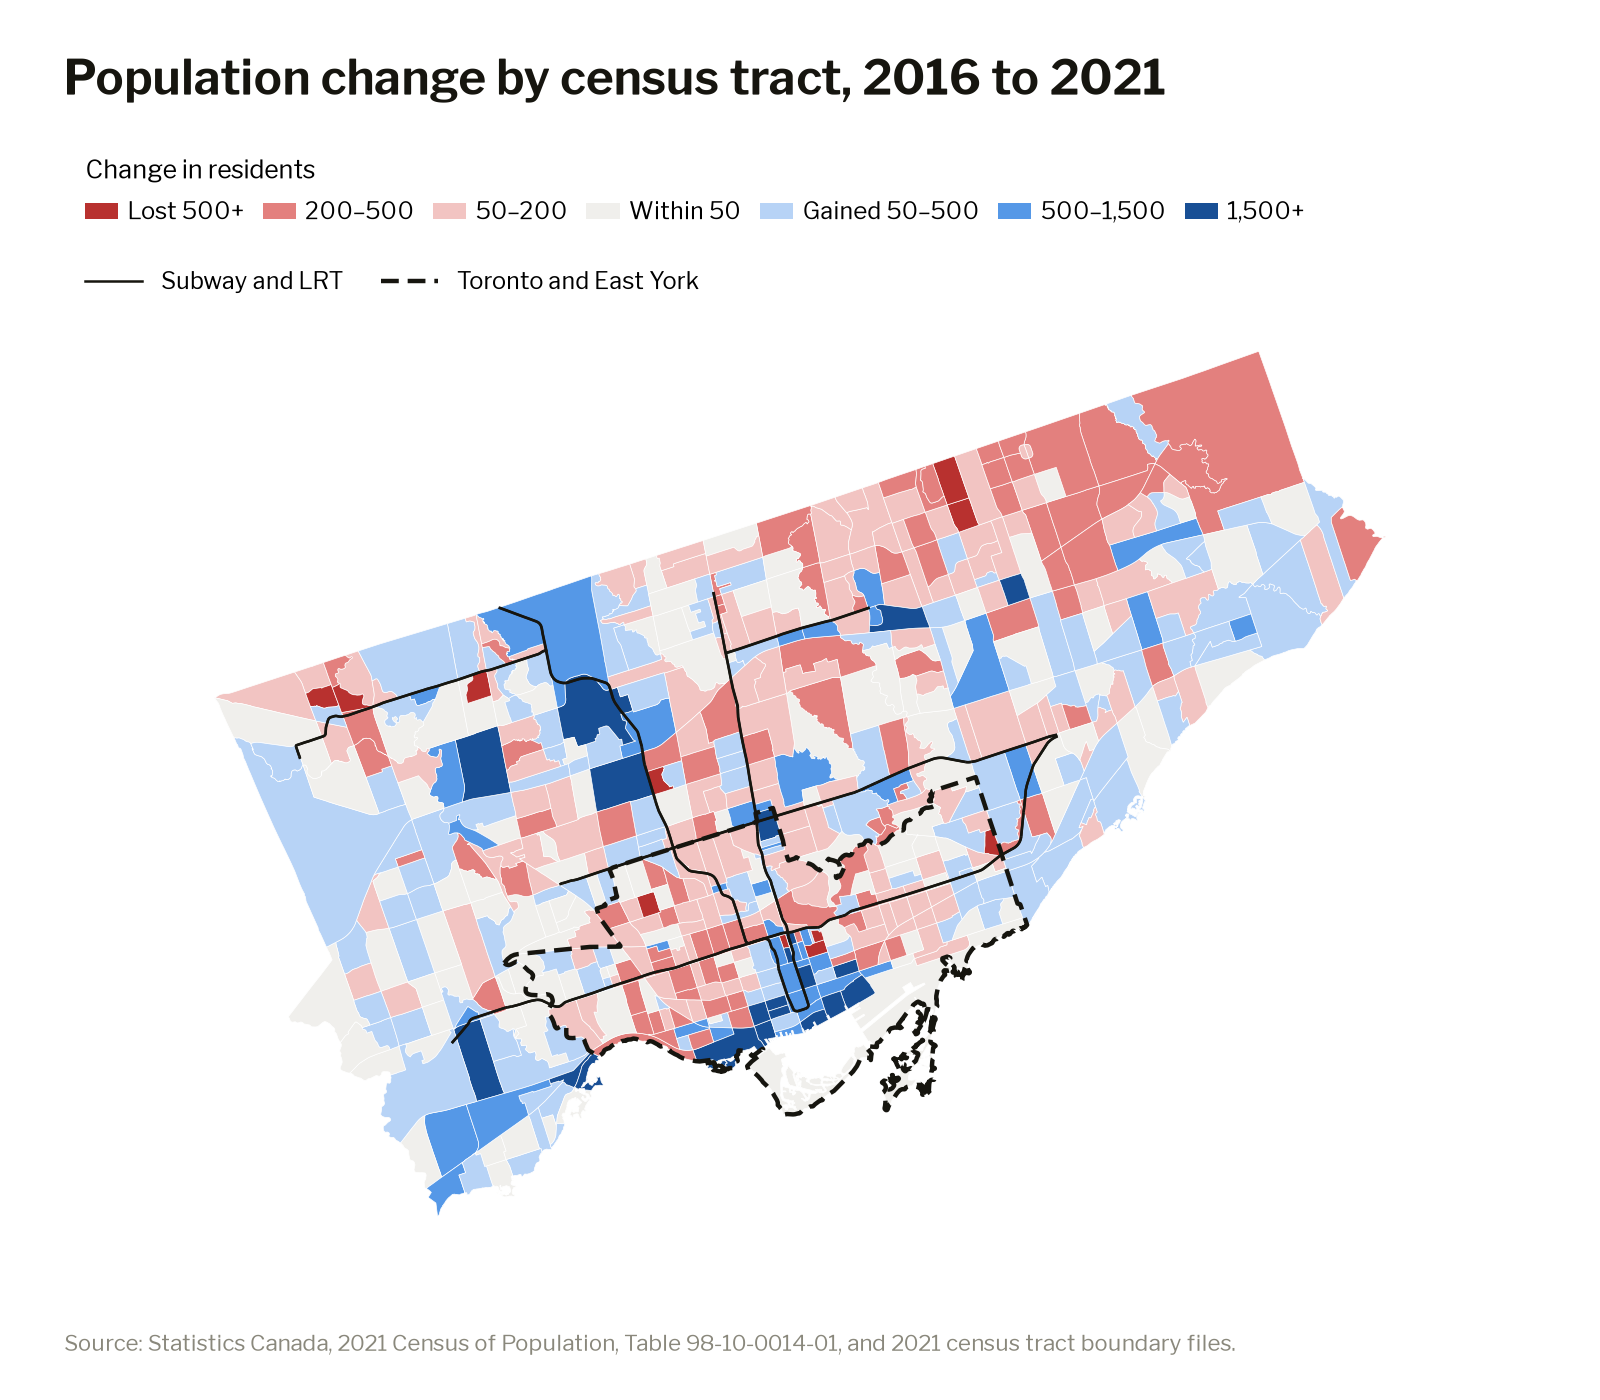
Looking at census tracts outside of Toronto and East York, between 2016 and 2021, the tracts that are mostly zoned for the yellow belt (low-rise residential) lost about 2,200 residents, while the rest of those tracts — the tower corridors — gained about 23,500.
As these towers become home to more people, often younger and more likely to be newcomers than the low-rise residential neighbourhoods around them, the desires of residents within those wards shift.
Chow’s tower tendency
Downtown, Mayor Olivia Chow’s support did not differ between the neighbourhoods and towers. Those living downtown, even in low-rise residential areas, are more likely to take transit, bicycle, support new housing projects and self-select for “progressive” ideals like funding services even if it means higher property taxes.
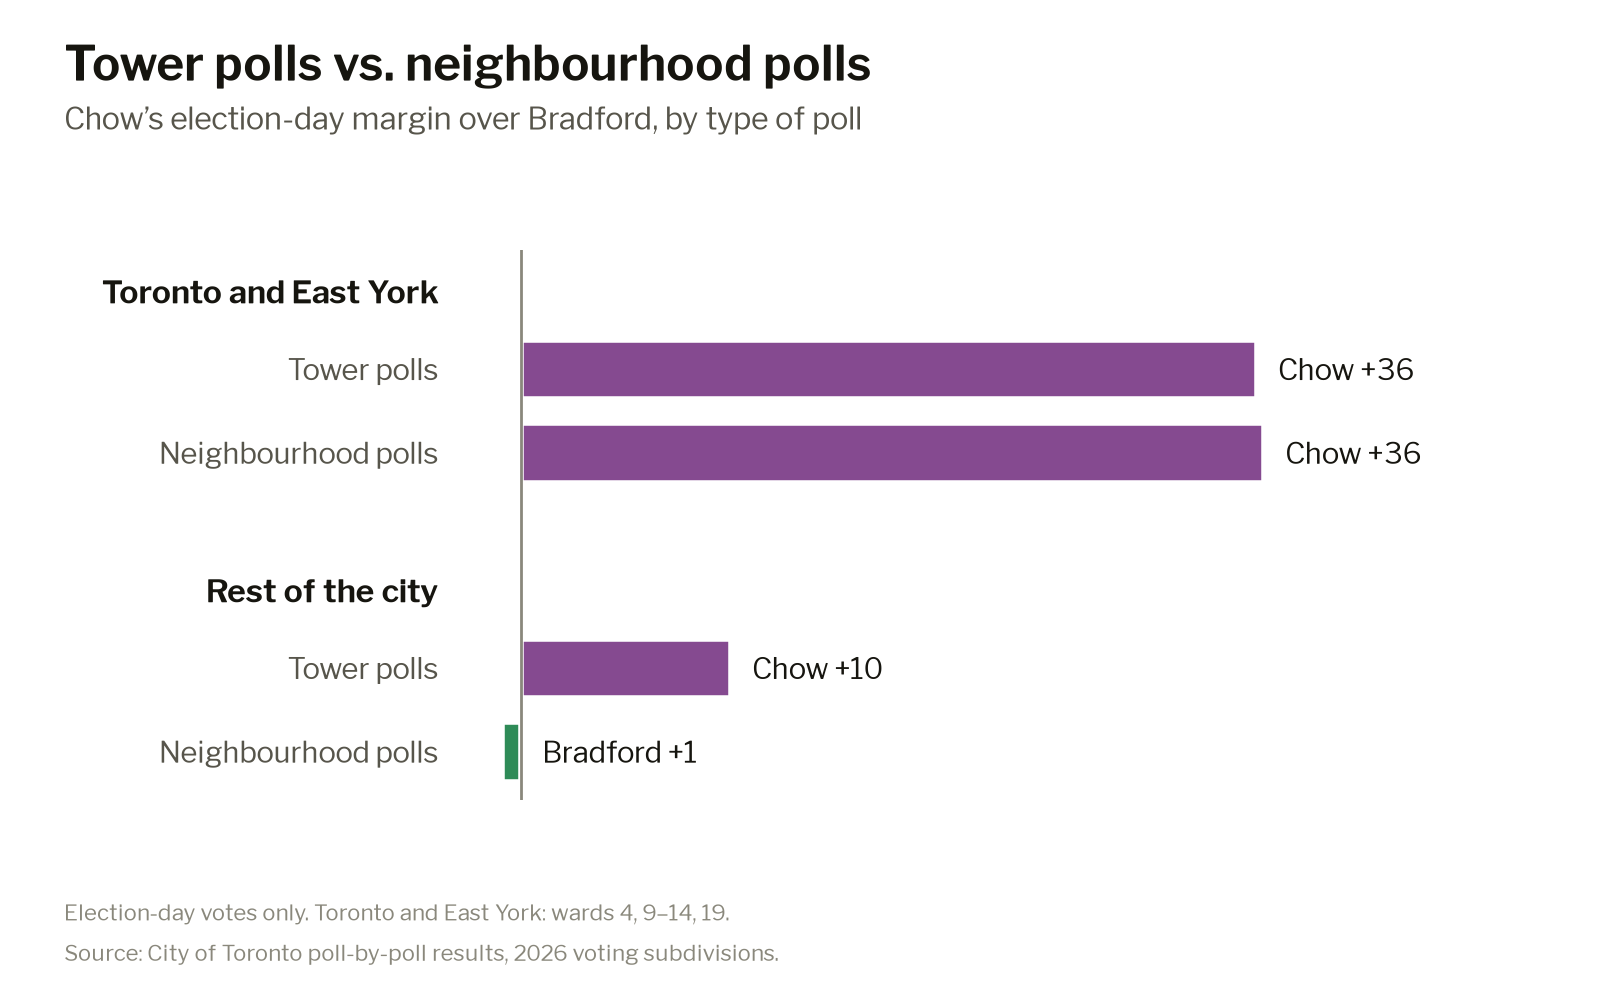
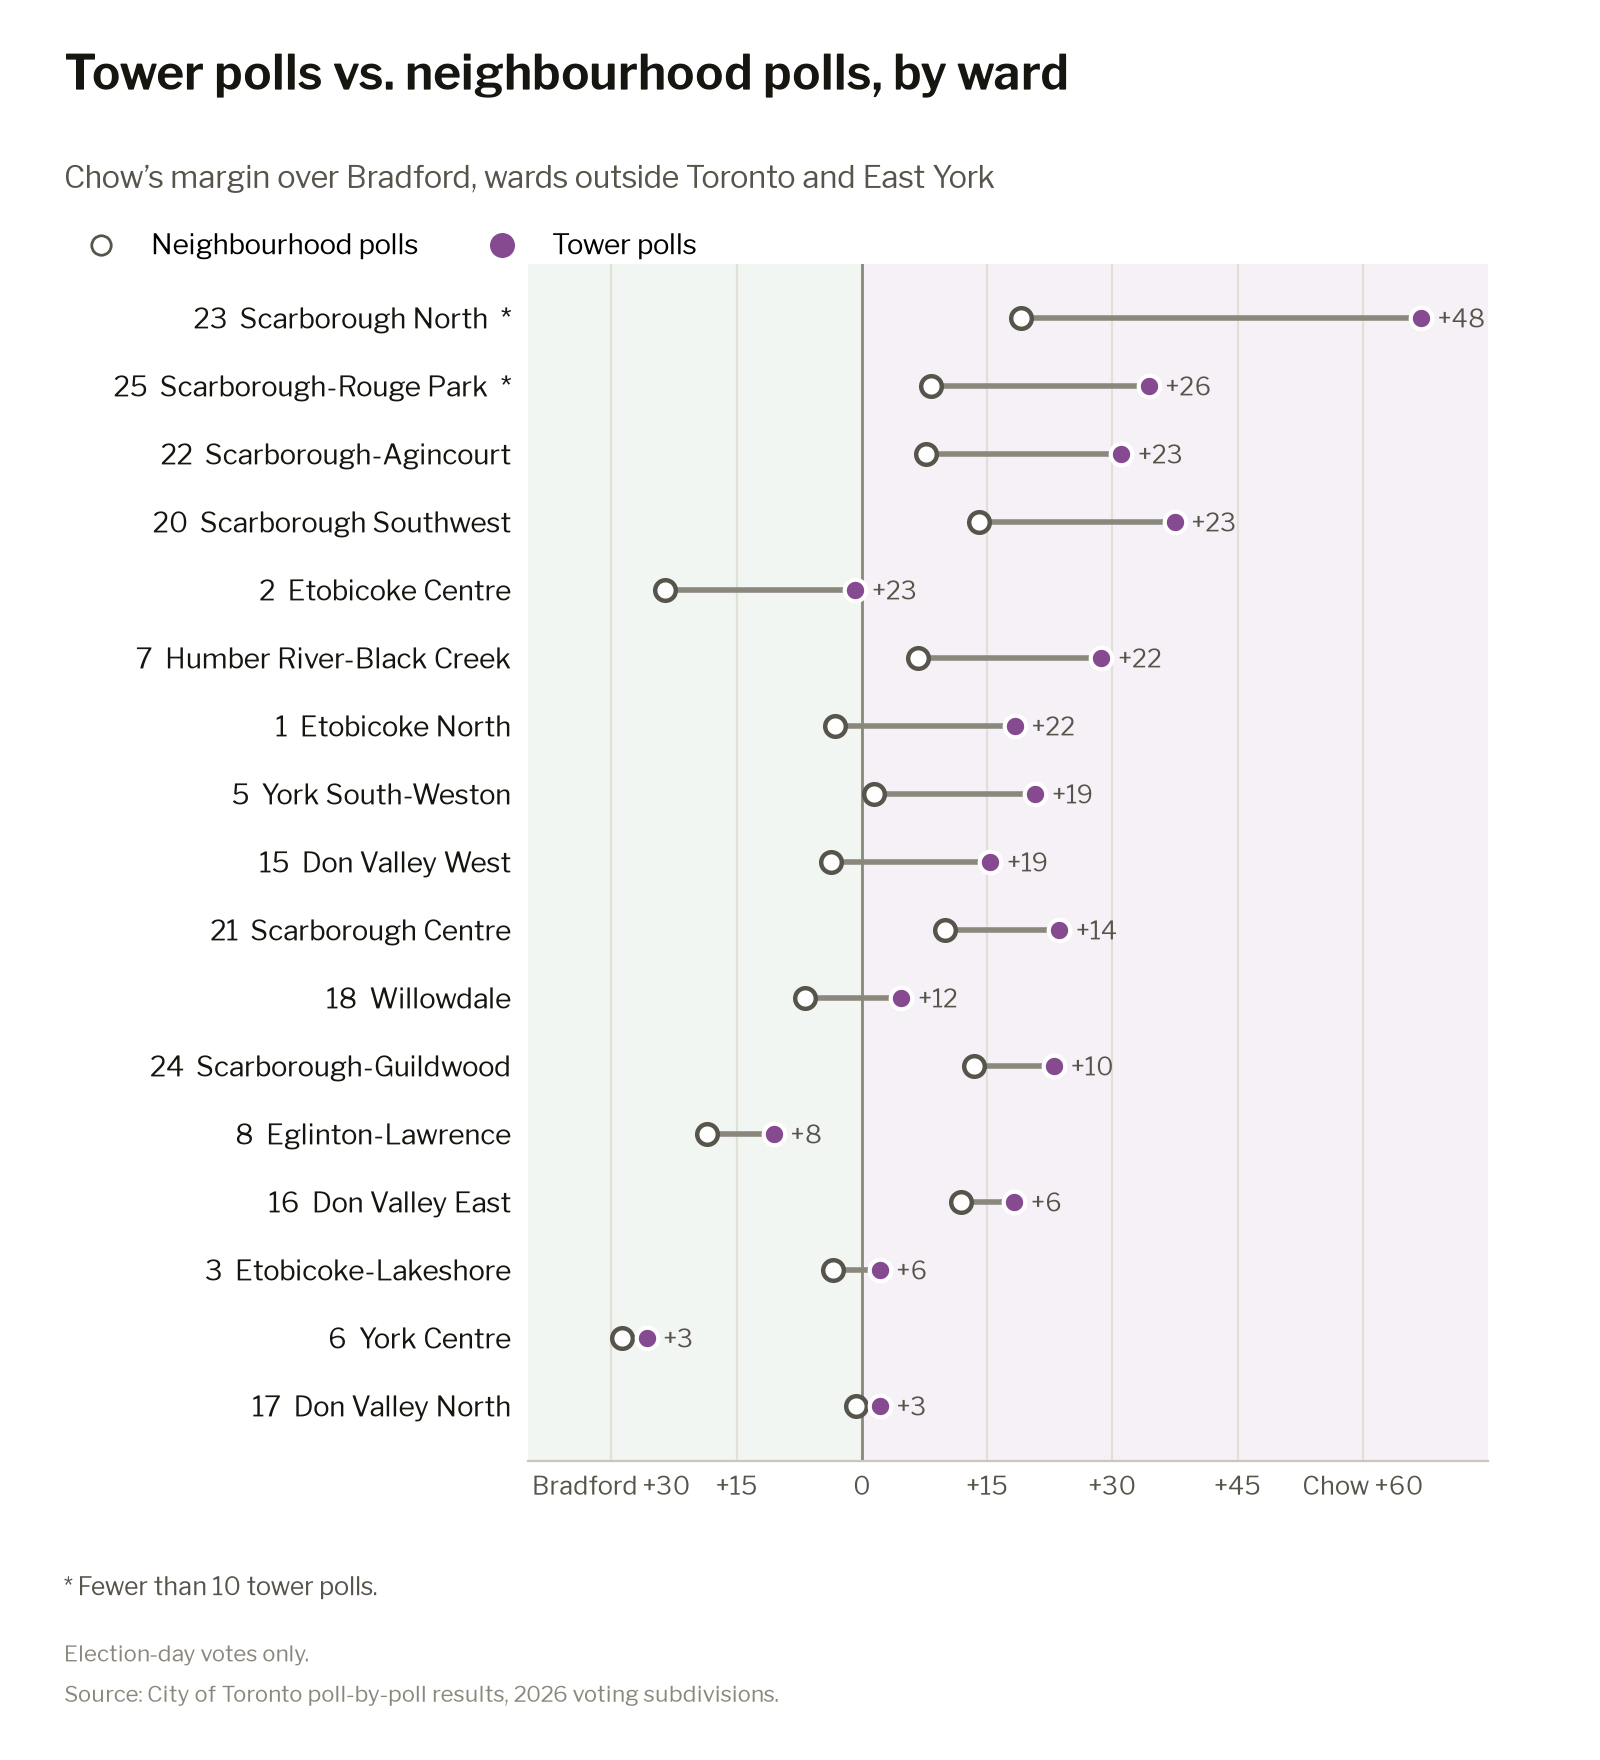
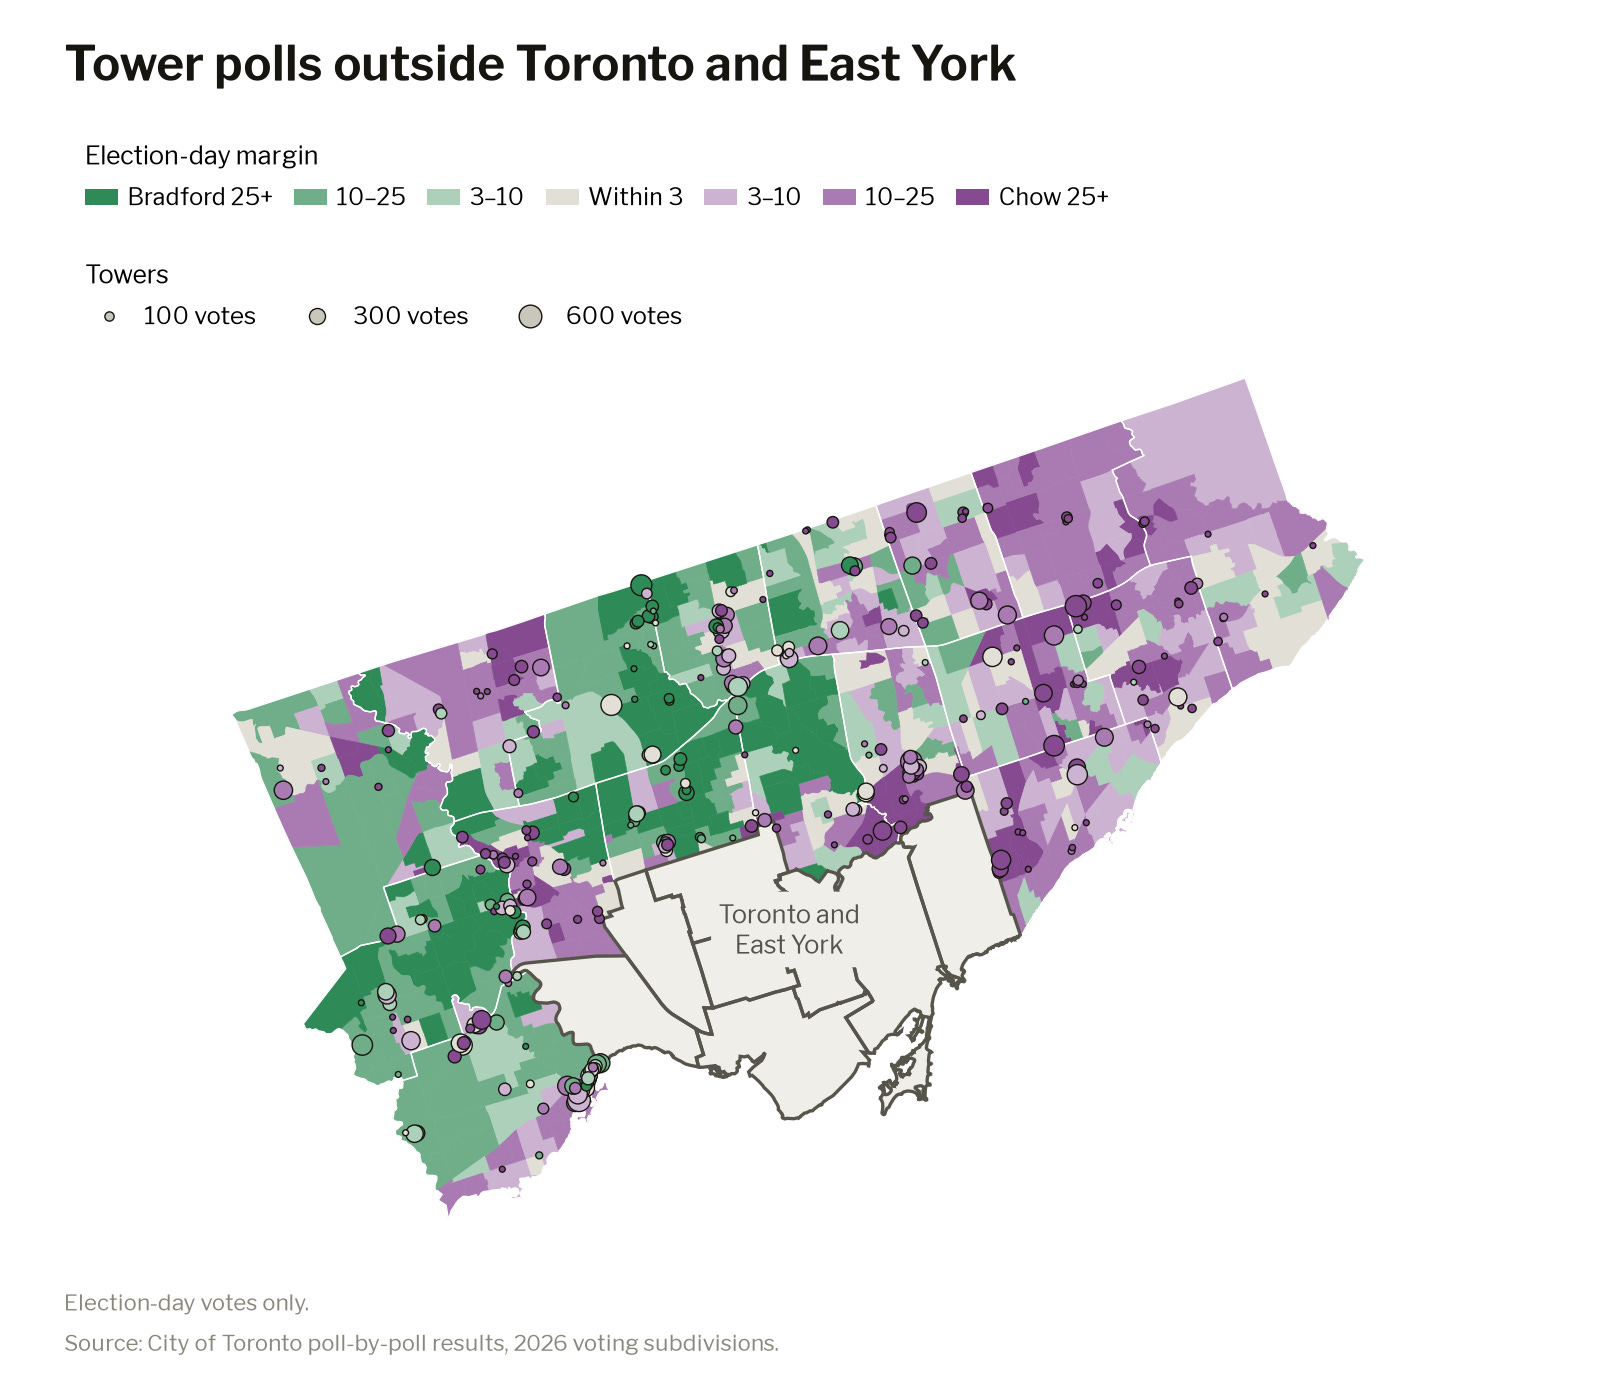
Outside of Old Toronto & East York, the story was different. Chow and Brad Bradford were essentially tied. However, Chow won subdivisions that were under 0.05km2 in size by 10 points. For the sake of this article, let’s call these “tower polls.” Tower polls are polling sites that serve either an individual building or cluster of buildings. In fact, Chow performed better in tower polls than neighbourhood polls in every single suburban ward.
Why does this matter? During Chow’s first term, there were two items that were part of the City’s “Expanding Housing Options in Neighbourhoods” (EHON) initiatives that the mayor allowed to have carve-outs. When it came to approving sixplexes and neighbourhood retail, suburban councillors were able to hinge their support for the items on the zoning amendments not affecting their wards.
Outside of Old Toronto, 52% of zoned land is in the yellow belt. These are the neighbourhoods that the carve-outs are trying to “protect”. It also means the growth that could have gone there keeps getting pushed into the same few corridors.
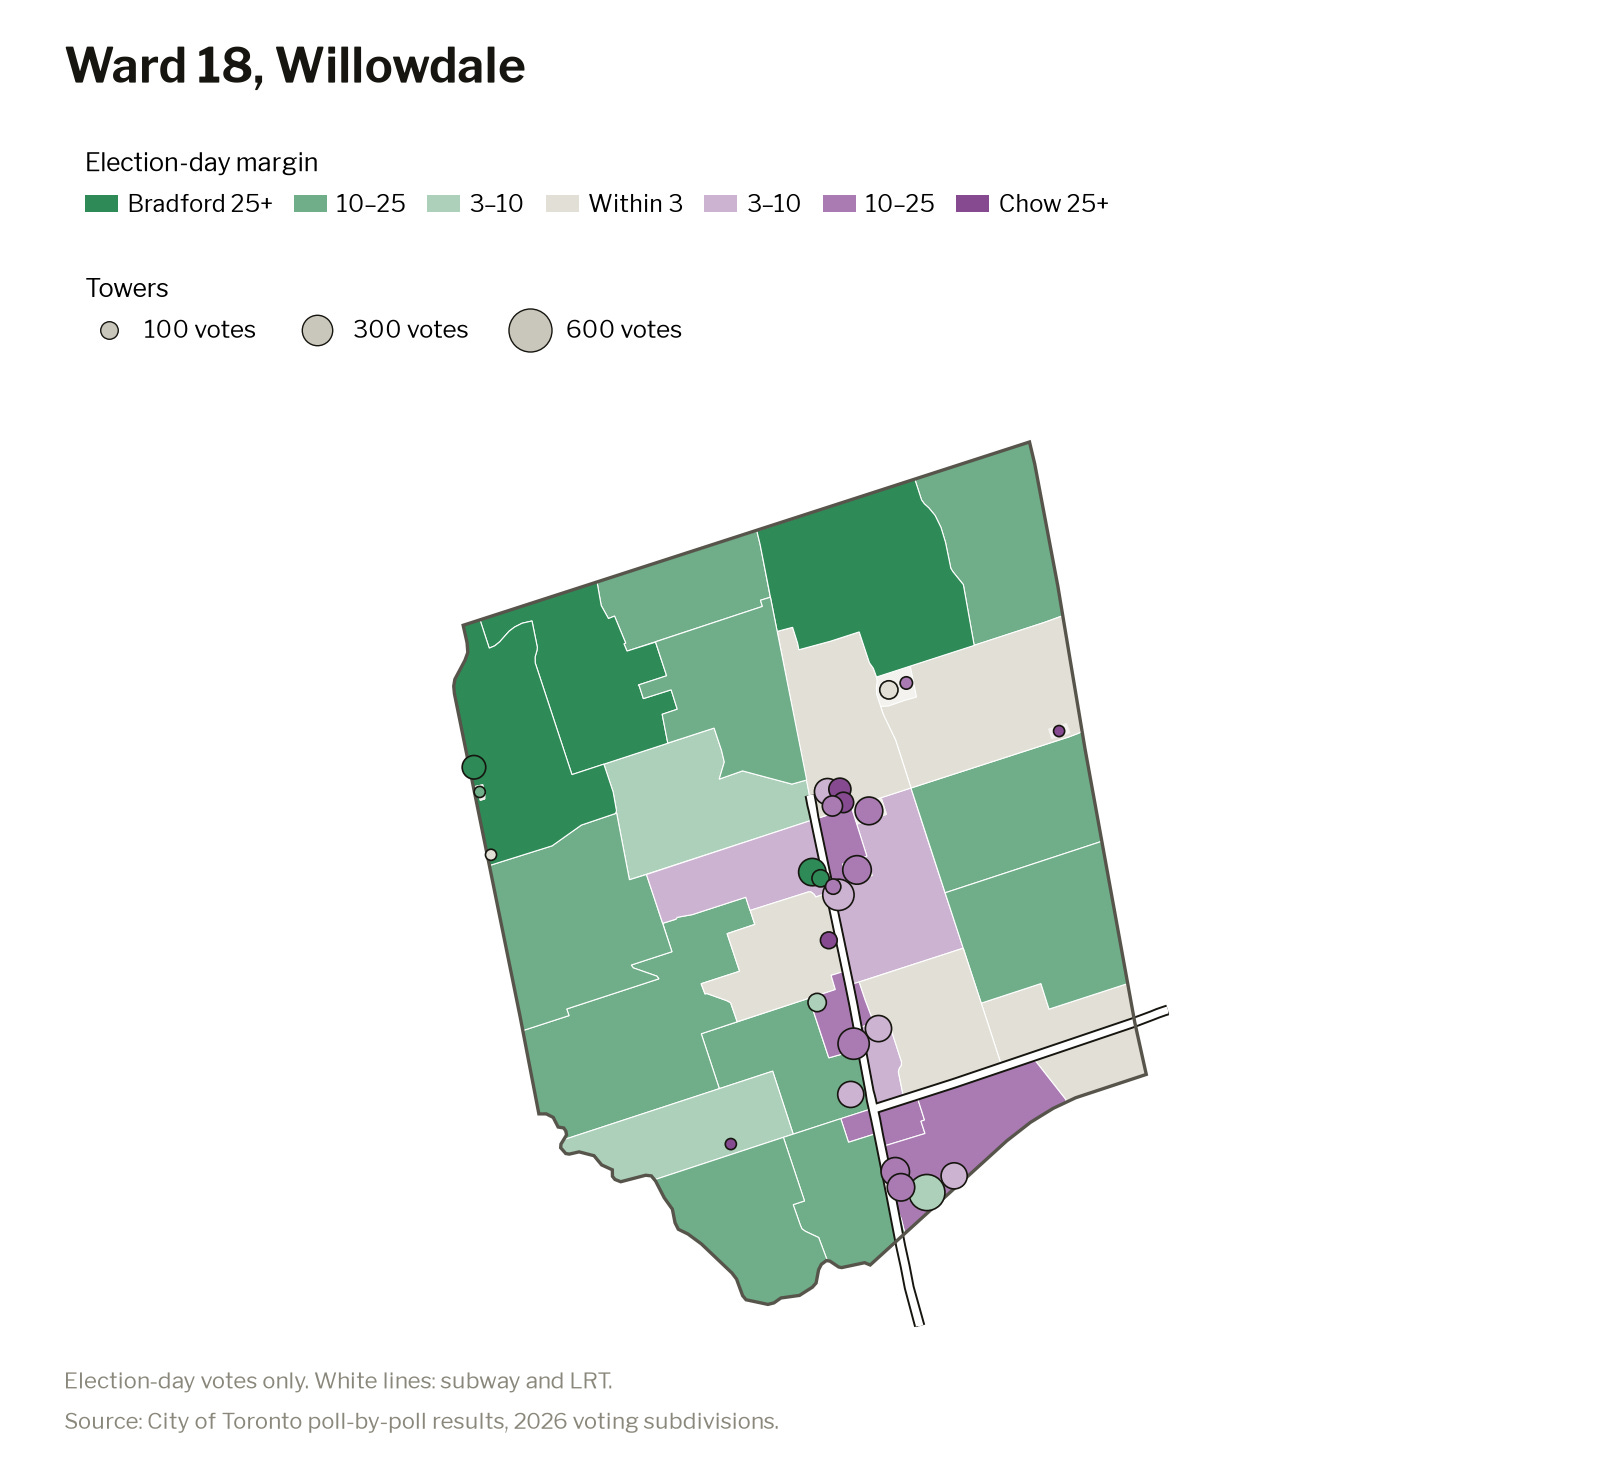
Willowdale is a perfect example of this. The ward’s tower polls, mostly along Yonge, went to Chow by five points. Bradford won the side streets on either side of the corridor by seven.
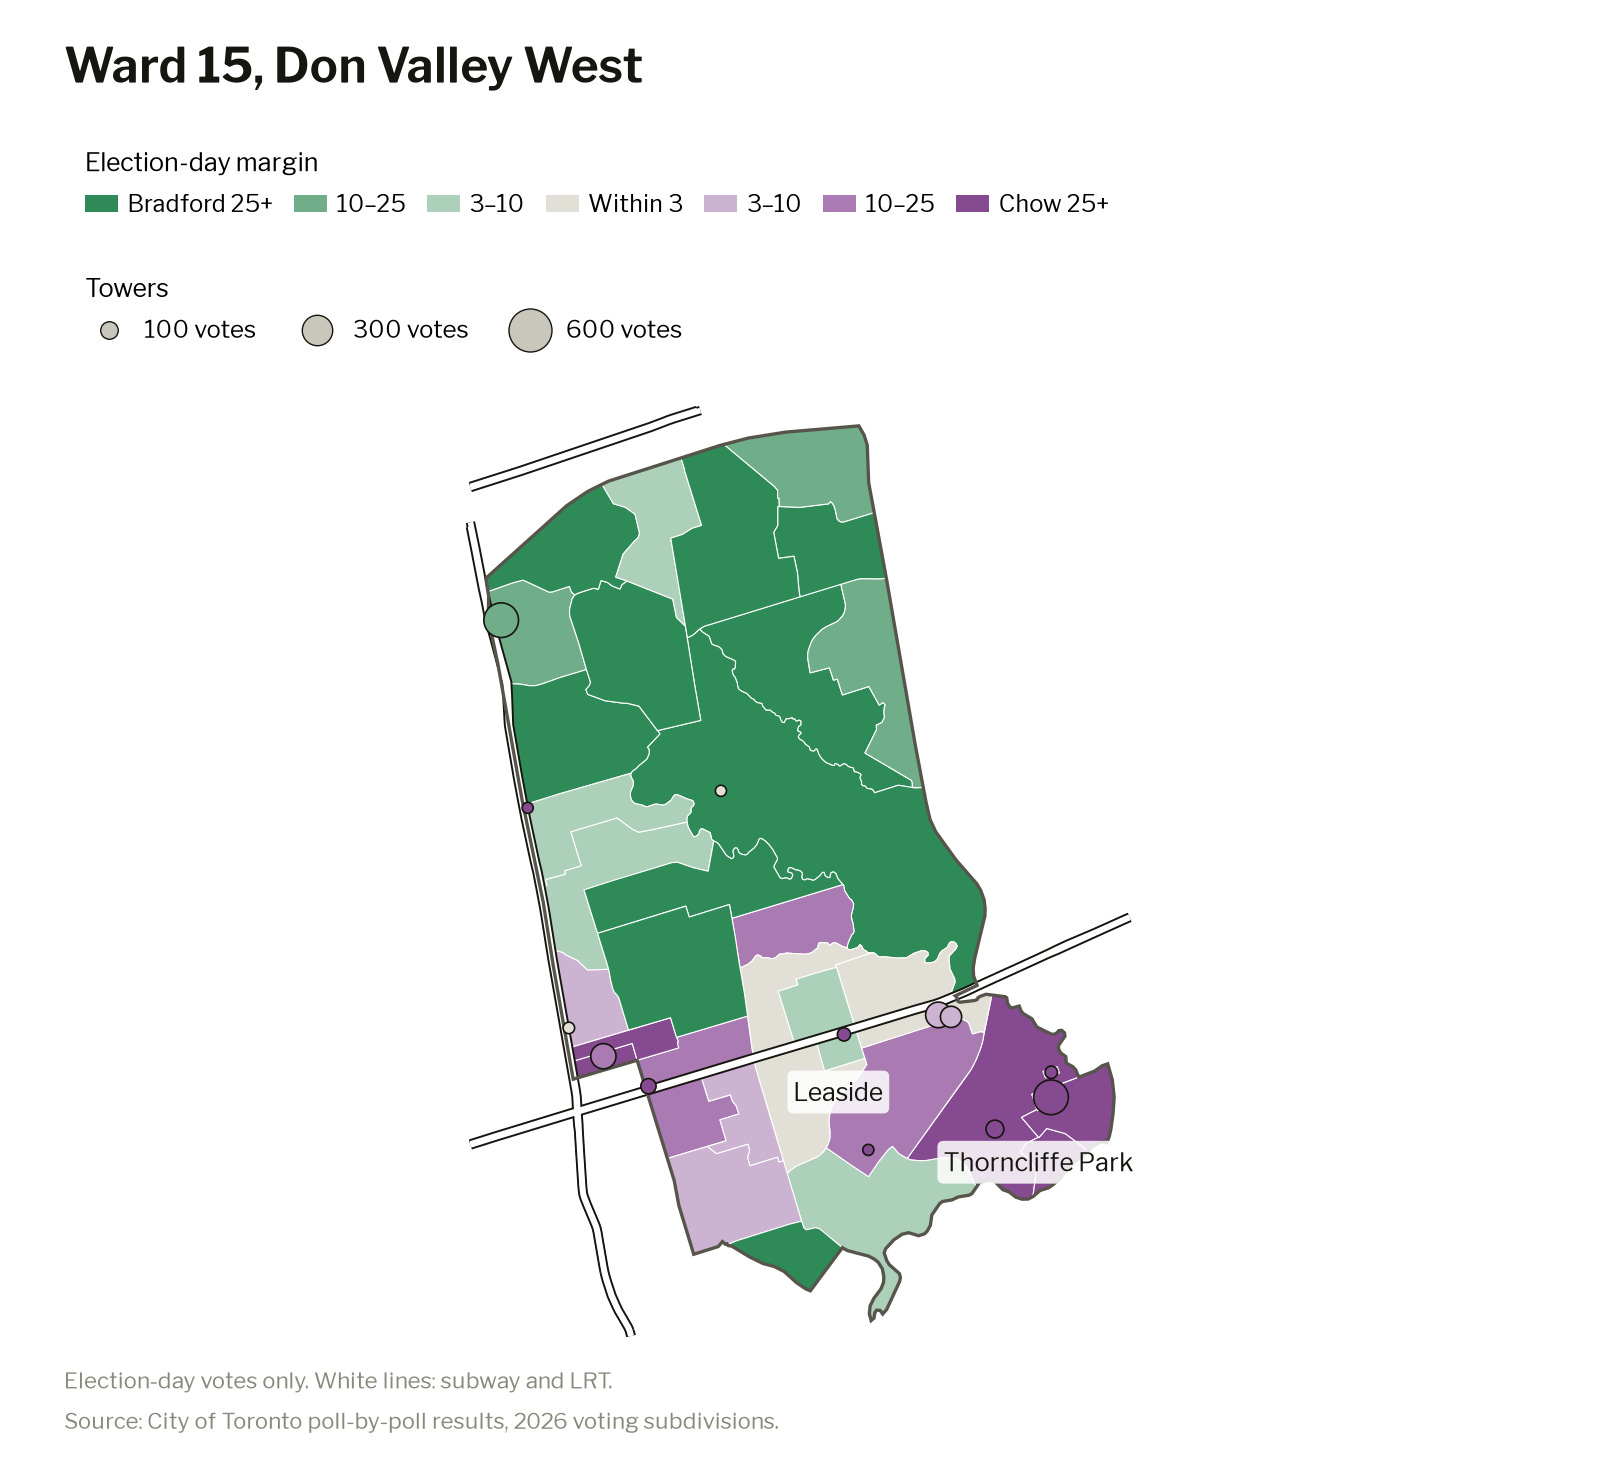
A similar phenomenon played out in Don Valley West, where new development has been constrained to specific transit corridors and “tower neighbourhoods” like Thorncliffe Park.
This pattern can be seen citywide, and suburban councillors would be wise to consider it.
Major transit station areas could become major voting bloc
When a suburban councillor asks to be left out of planning reforms to allow sixplexes or corner stores, they are speaking for the low-rise neighbourhoods. The data suggests people in the towers down the road are not necessarily on the same page. Even though tower polls are a small share of the vote, making up only about 12% of election-day ballots outside of downtown, they are where most of the new housing is going. That growth is also about to speed up. The City is planning for more density in “Major Transit Station Areas” (MTSA), the land area around subway and LRT stations. Over half of these stations are outside of the core.
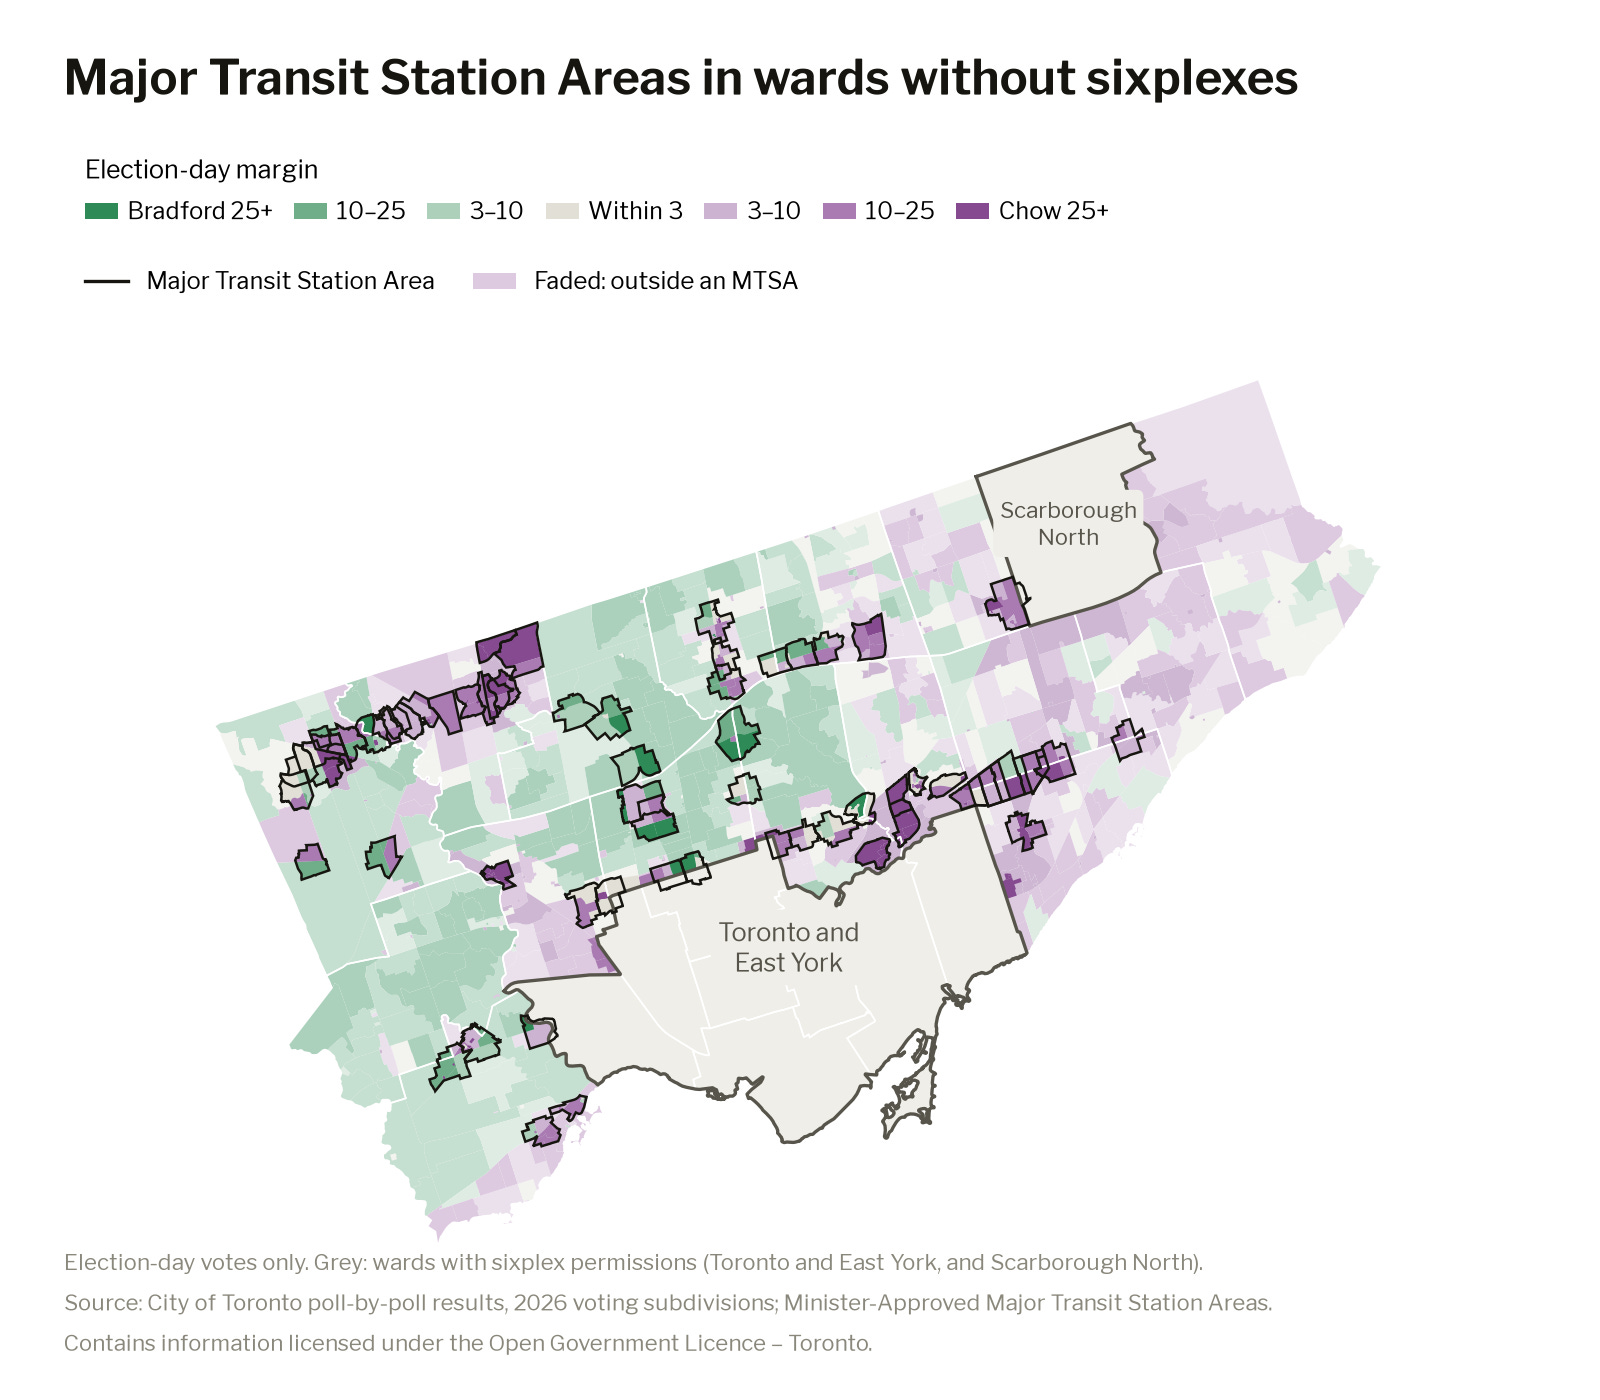
The polls inside those station areas already lean toward Chow. In the wards that were carved out of the EHON initiative on sixplexes, she won the polling divisions within MTSAs by 12 points, while losing the rest of the polling divisions to Bradford by three. In every outer ward with a station area, Chow did better inside it than in the rest of the ward, by 17 points on average.
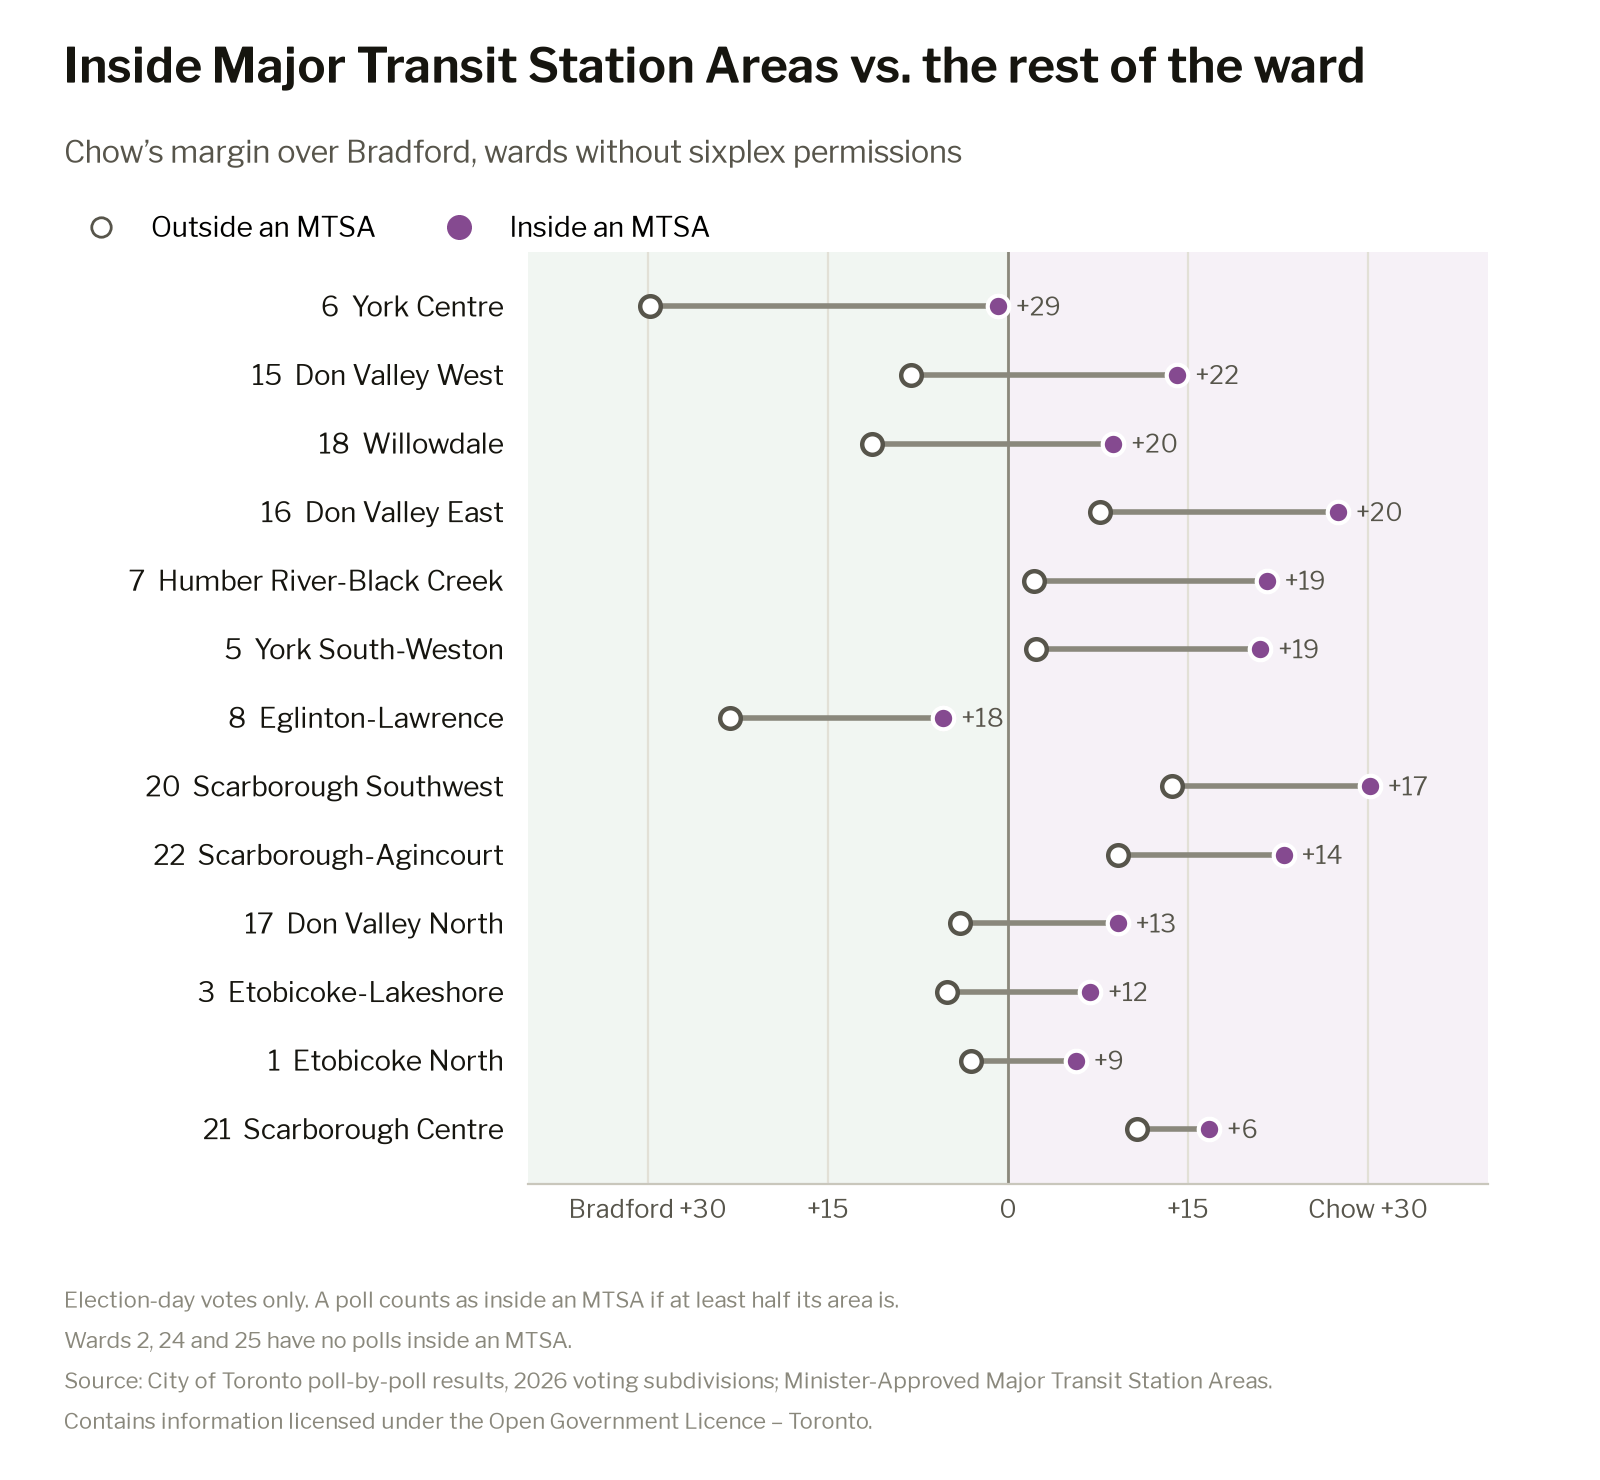
With further development occurring in this pattern, the path to victory for a local councillor will surely move with it. Councillors in these wards should not operate under the assumption that they will stay suburban with a constituent base that has suburban sensibilities forever.
Isaac Berman is the creator of Observing The City, a project aimed at bringing transparency to data that is often hidden in PDF-based reports uploaded as attachments to City Council motions, and instead making it interactive and easy to digest. He hopes to be able to shift narratives that are often shaped by small interest groups and instead democratize access to information. You can follow Observing the City on Bluesky, Twitter, and TikTok.
Election Projection: How did our model do?
By Alex Olson
Now that the election is over, we can look back on our modelling and see how we did. As a reminder, our model’s final projection was a two-thirds chance that Chow would win, and by an average margin of about seven points. In real life, Chow won 100% of the time (in one election) and by 13 points. So was our model any good? How do we tell, and how does it stand when we compare it against other approaches?
