Intersecting interests all across Toronto
City Hall Watcher #270: An INTERSECTION INSPECTION SPECIAL responding to requests for Yonge & St Clair and Liberty Village. Oh, and on a lark, I charted 1,000 other intersection counts
Hey there! Welcome to the 270th issue of City Hall Watcher. I think I see issue #300 coming, just over the horizon. That’s a big one.
But let’s not get ahead of ourselves. This is a big one, too. In this issue, I’ve finally found time and space to return to the always-popular INTERSECTION INSPECTION feature, wherein I take requests and dive deep into the data from traffic counts at specific intersections.
In most cases, the data dates back to the 1980s. That’s great both for analysis and for allowing me to reference 1980s media, like Denver the Last Dinosaur. Does anyone else remember Denver the Last Dinosaur?
This issue gets introspective in response to two requests: one to look at Yonge & St Clair, and one to look at an intersection in Liberty Village.
And for funsies, I also compiled a list of more than 1,000 traffic counts conducted by City Hall in 2023 and put them in a big data table. You can sort it and search it and just generally have fun with it, you big nerd.
One more note: every tenth issue of City Hall Watcher — like this one — is sent out free to everybody on the email list. If you’re not yet a paying subscriber but like what you see here, please consider signing up.
— Matt Elliott
graphicmatt@gmail.com / CityHallWatcher.com
Read on the web / Archives / Subscribe
Intersection Inspection: Yonge & St Clair and Liberty Village
Intersection Inspection is a recurring feature in which I comb through four decades of traffic data to look at how intersections have changed.
I take requests. This issue responds to two requests sent in following the last edition, which looked at Danforth & Playter.
Yonge & St Clair
First, Yonge & St. Clair. Reader Cathie wrote in asking if I could take a look, noting that, among other things, there was a recent cyclist death, the streetcar is currently shut down, and that it needs surface repairs to address hazards for pedestrians.
Well, there is certainly no shortage of historic traffic counts here.
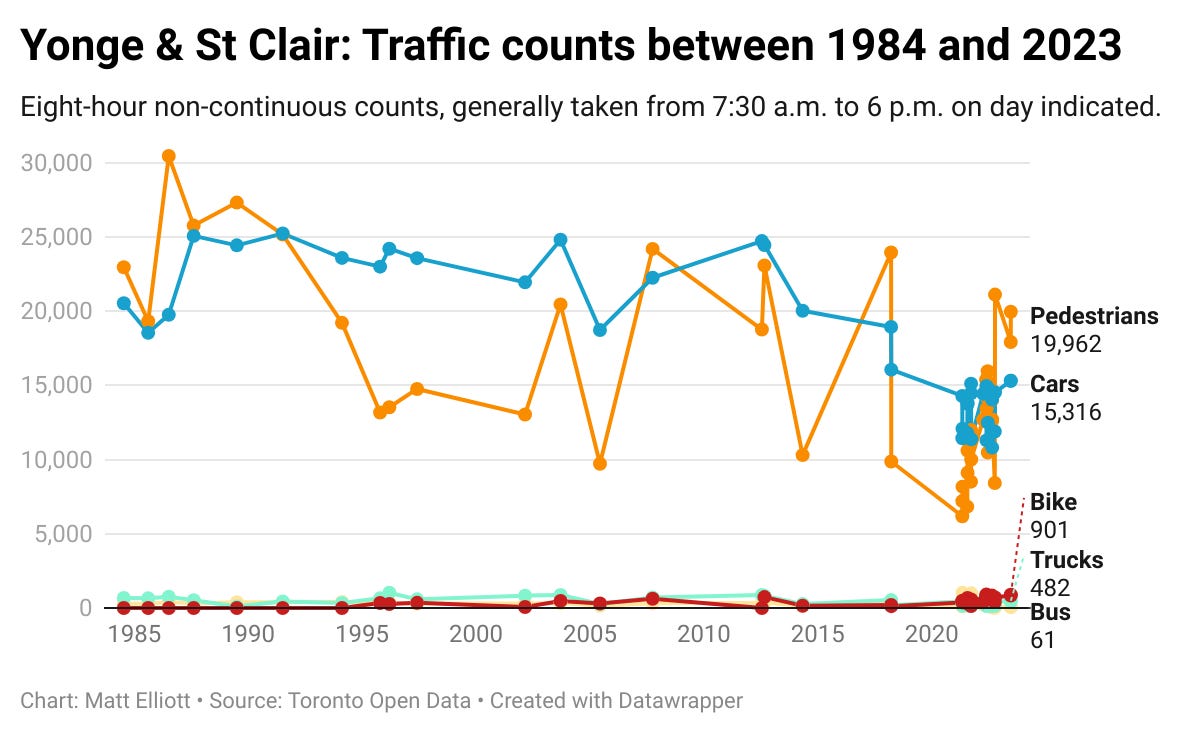
One thing that immediately jumps out: for my entire lifetime, Yonge & St Clair has been an intersection that often serves about as many pedestrians as it does cars. Even in the depths of winter on dates in the 1980s and 1990s, the share of pedestrians is healthy.
Sometimes, there’s this idea that Toronto was a city for cars until a bunch of kooky advocates started pushing for bike lanes and wide sidewalks, but data like this shows otherwise.
The three most recent counts show what could be the “new normal” for the intersection, with traffic counts for pedestrians representing between 54% and 57% of all traffic counted.
Plotting the data as a line graph—recognizing, of course, that there are varying gaps between counts and they’re taken at different times of year—makes for a noisy visualization. However, it does a decent job of showing how the raw number of cars passing through has declined since peaks in the 1980s.
Cars haven’t seen a count above 20,000 since 2014.
Bikes represent a small share of overall traffic, but if you can look past some COVID and seasonal spikes, maybe a trend is emerging.
Liberty Village
Reader Meg wanted to know if there was much traffic data about Liberty Village, one of Toronto’s faster-growing condo neighbourhoods:
I have a question about a street, rather than an intersection. Whenever I bike along East Liberty St, I’m struck by how horrible it is. Overly wide space for cars, no separated bike lane, narrow sidewalks, few trees, few shops/restaurants along the sidewalk. For such a central neighborhood with thousands of people living there, it’s hard to believe the majority would be using cars. Is there any data on modeshare (car/transit/bike/foot) for that neighborhood, and the street in particular?
Unfortunately, there is not a ton of data on this. It’s strange—and maybe telling, and maybe not surprising—that even though Liberty Village has seen tremendous growth and development over the last few decades, the City has not done much to study travel patterns in the area.
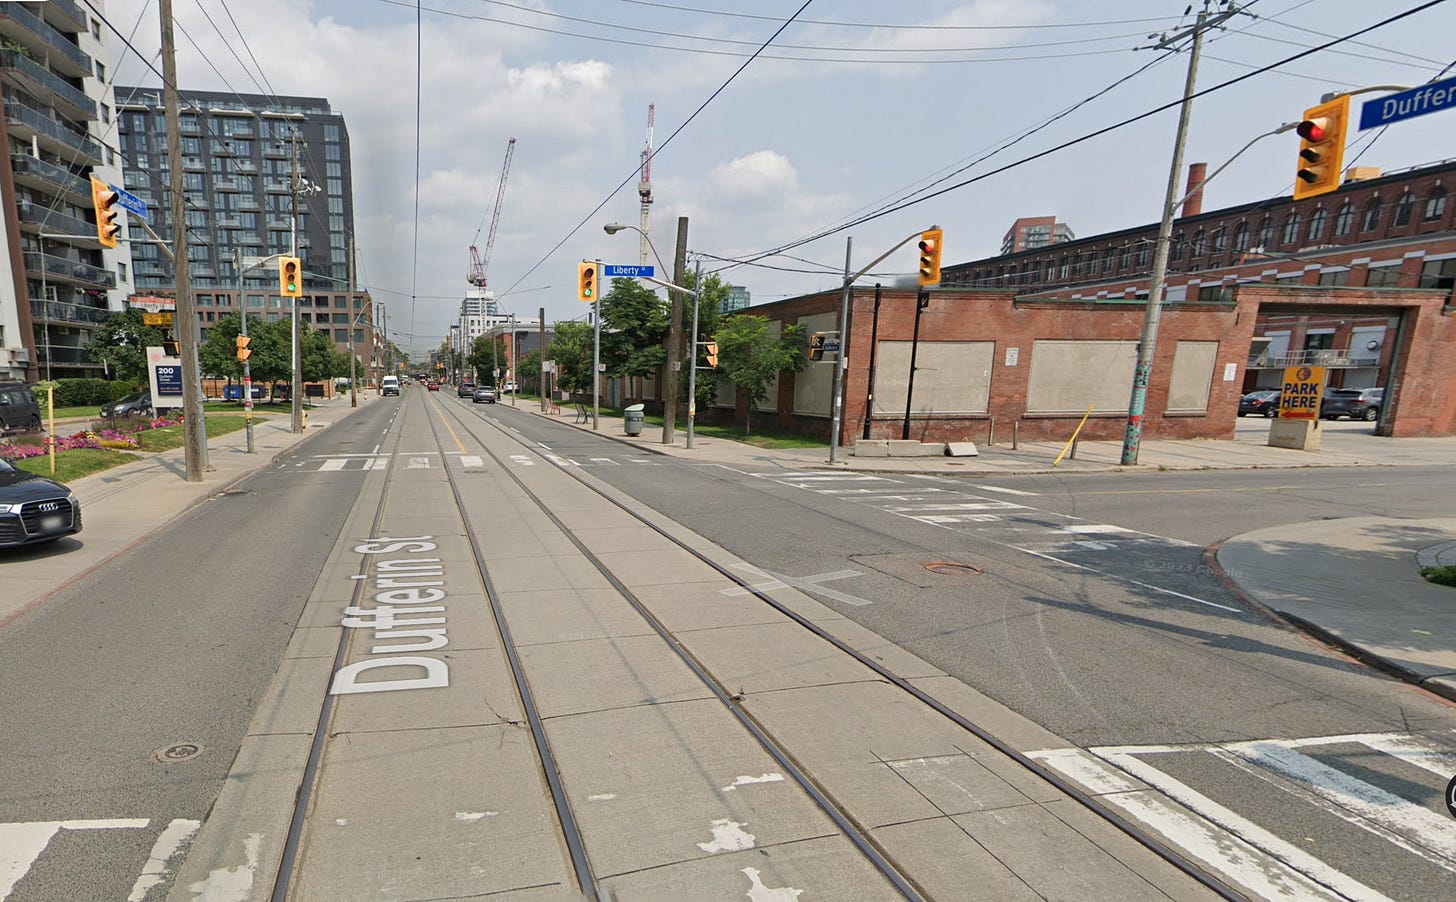
So, while I’d love to analyze an intersection like East Liberty and Strachan, the best data points relate to Dufferin & Liberty Street, a western entrance to the neighbourhood.
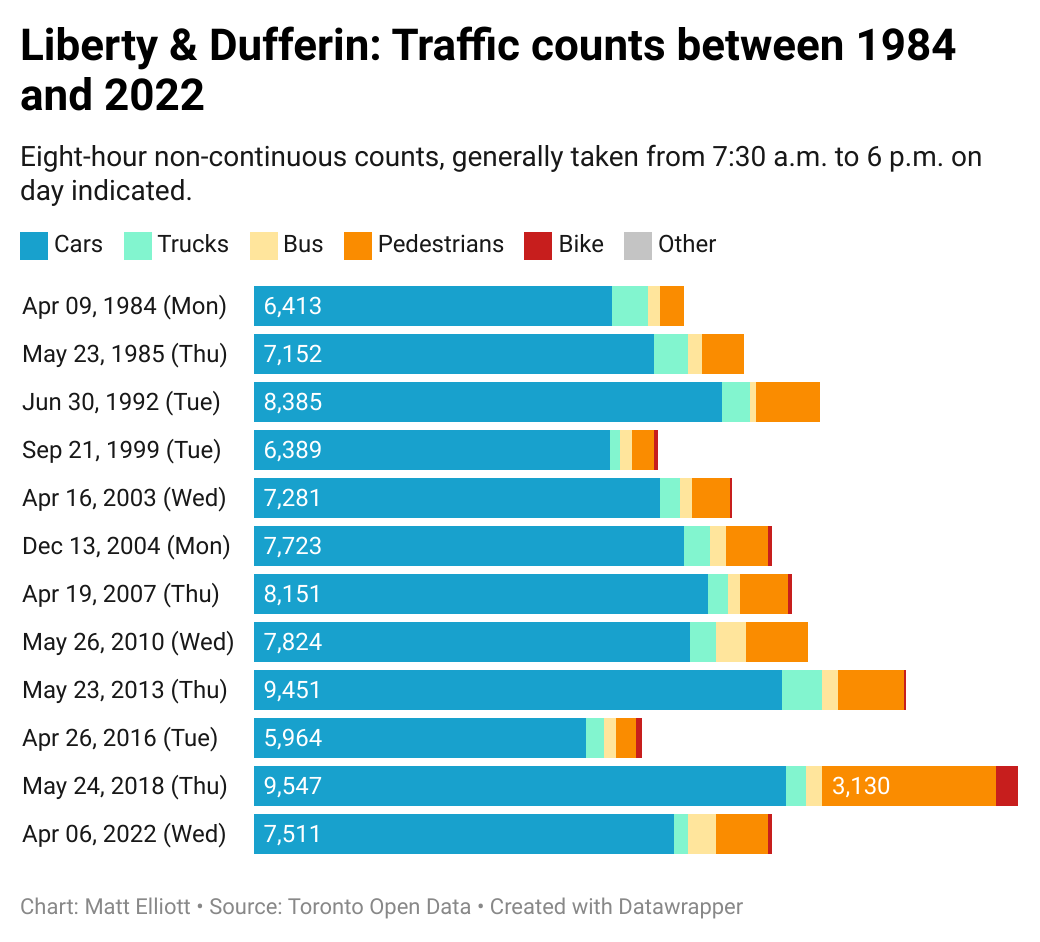
Here’s what the data shows for that intersection.
Compared to Yonge & St Clair, it’s notable how much this intersection still skews toward cars. COVID probably impacted the most recent count in 2022, but even the 2018 count doesn’t show as much change as you’d think from a count taken on almost the same date in 1985.
I’ve never been a Liberty Village resident, but based on the population and types of housing, I would assume that an intersection like this should have more pedestrian traffic.
With the neighbourhood making headlines lately after some residents opposed more development due to what they’re calling a lack of infrastructure, it’d be nice to see some more data on travel patterns.
📣 Thanks to Meg and Cathie for the requests! If you’ve got an intersection you’d like me to inspect, let me know. You can reach me via email — just reply to this message — or in the comments section.
Intersection Inspection Special: all 2023 traffic counts
Hey, putting together those two editions of Intersection Inspection was a lot of fun. Let’s do one thousand more.
Toronto’s Transportation Services division conducted 1,029 daily traffic counts in 2023. The chart above lists the top 15 by total traffic volume counted. It’s interesting that an August 1 count at Yonge & Carlton took the top spot over a June 21 Yonge & Dundas count, even though the latter tends to loom large in our minds as the busiest spot in the city. In both counts, though, there were three times as many pedestrians as cars.
I’ve put together the full list, searchable and sortable by a bunch of different metrics.
Here are the top intersections for pedestrians and cyclists, ranked by their combined share of traffic.
The top spot here goes to Cabbagetown’s Ontario Street & Winchester Street.
Kensington Market also ranks highly for pedestrian share, as does Princess Street & Scadding Avenue in the St. Lawrence Neighbourhood, which was recently redesigned to make way for bus lanes and bike lanes.
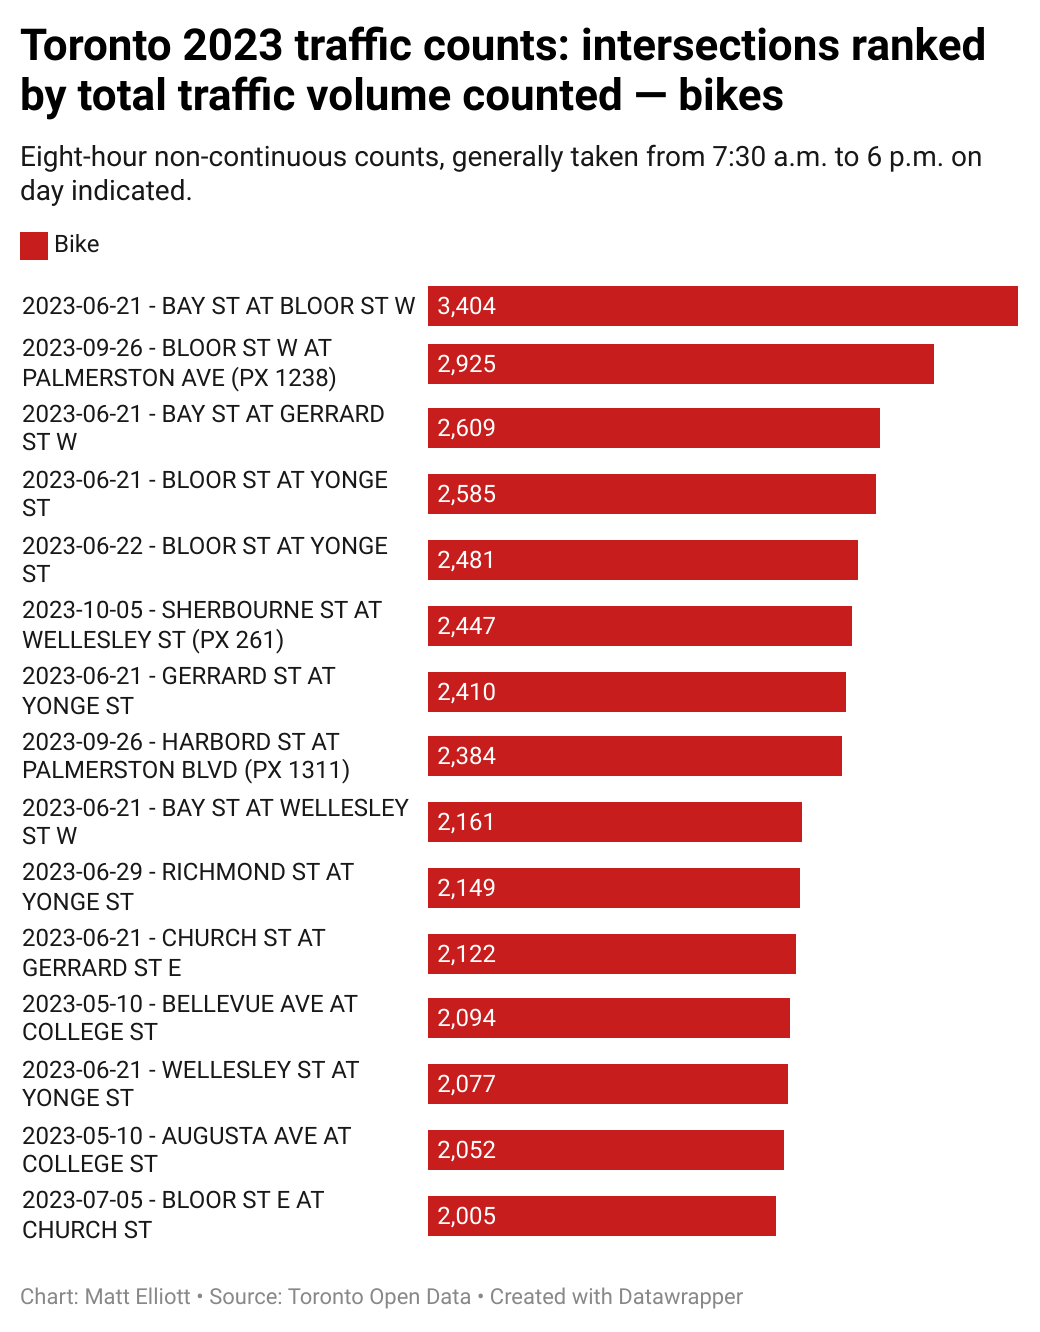
Speaking of bikes, here’s the busiest cycling intersections counted.
Be cautious when making sweeping conclusions from any of this data, as it is subject to a significant selection bias. Not all intersections are counted in any given year. Some are counted frequently. Some are never counted. But it’s an interesting reflection of how we move about the city.
More from Matt: on preventing renovictions, and preventing road carnage
📰 For the Toronto Star last week, I wrote about City Hall’s move to take a cue from Hamilton and start work on a bylaw to fight renovictions. The Hammer is always banging out good ideas.
🗞️ For the Star this week: was it just me, or did February seem like a particularly bad month for pedestrians and cyclists on Toronto streets? I dig into some data to find out.
Look for it in your favourite newspaper.
The Week at Toronto City Hall
➡️ For a rundown of this week’s meetings, see Friday’s issue of City Hall Watcher.
City Hall Watcher #270
Thanks for reading! Send in those Intersection Inspection requests. The lines are open.
I’ll be back on Friday with a special bonus issue to get you set for the March Council meeting.


Bus is a tiny sliver in all these graphs, it could be interesting to figure out average people on a bus and scale it up
The population centre for LV is significantly further east, most people don't end up walking along liberty st past Dufferin because there are not many destinations west of there that are south of king.