The year in charts
City Hall Watcher #207: A look back at another chart-filled year of watching City Hall
Hey there! Hope your holiday is going well. As we say goodbye to 2022, I wanted to take my typical trip back through the year that was.
That’s right: it’s time for the year in charts.
I’ve gone through the issues for each month of the year and pulled a chart or visualization that best encapsulates the municipal mood. The gang’s all here: bar charts, line charts, data tables, maps, and — because it’s the season — pie charts.
Before we dig in, some gratitude is in order for those who gave the gift of City Hall Watcher this year. Thanks for supporting indie journalism. And, of course, I’d like to welcome those of you who received subscriptions in your proverbial stocking this year. I hope you dig it.
A reminder: for new subscribers, City Hall Watcher's base price will increase to $6 a month or $60 a year in the new year. Active subscriptions will remain locked in at current rates unless you cancel or let your subscription lapse. So if you want to get in at the current rate, you’ve got a few days left to sign up.
Lots of charts means this issue runs long. Readers using Gmail on the web may get cut off midway through. To read the whole thing, you can view the web version.
— Matt Elliott
@GraphicMatt / graphicmatt@gmail.com / CityHallWatcher.com
Read this issue on the web / Browse the archives / Subscribe
2022: the year in charts
Previous years, in charts: 2019, 2020, 2021.
January
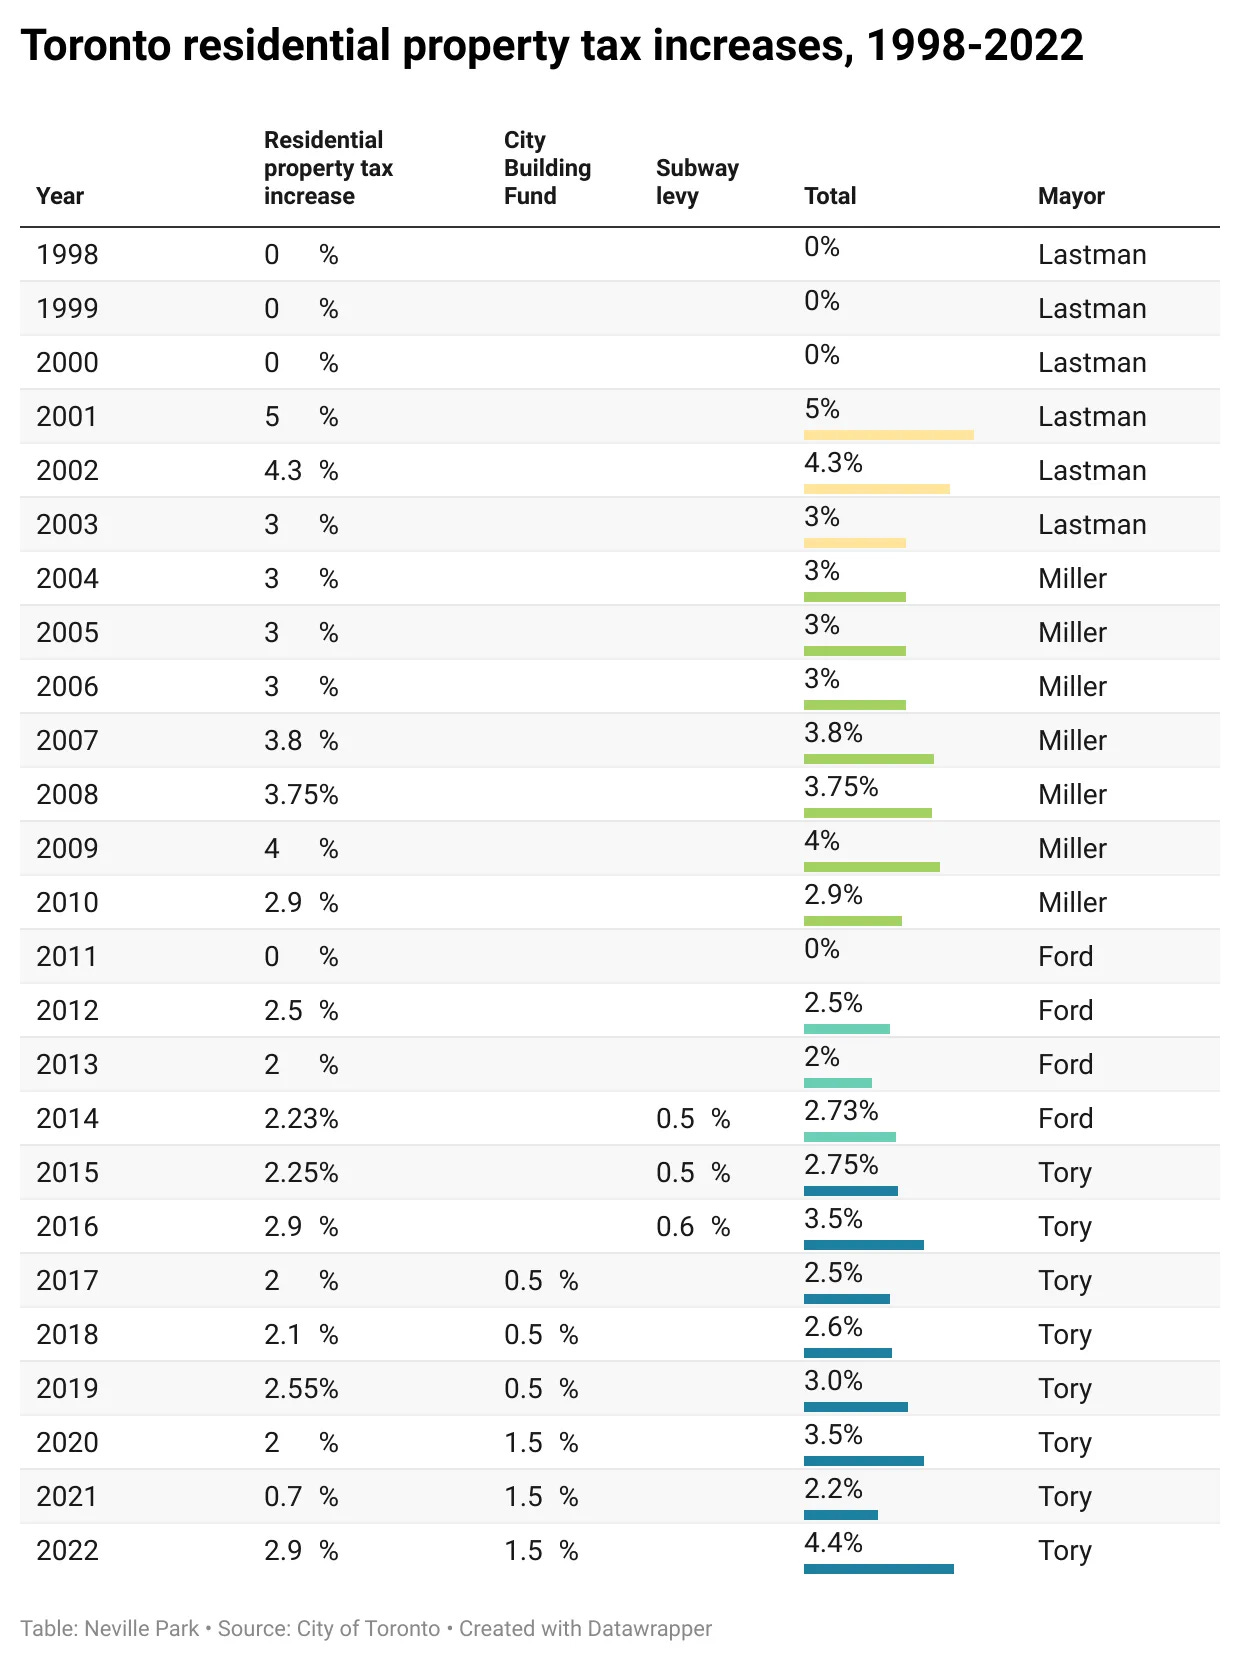
I took the month off to deal with the new tiny human living in my house, but Neville Park and Glyn Bowerman ably steered the ship.
Glyn gave us context on the cop budget and teed off on the debate over the city’s public golf courses, while Nev branched into tree journalism and looked at the City’s overcrowded shelter spaces.
Nev’s budget preview was predictably jam-packed with charts, including the visualization above, looking at more than two decades of property tax increases. Useful context for the budget debate to come next month.
February
I returned in February, battle-scarred but triumphant. In between looking at the lobbyists championing sidewalk robots and examining police crisis response data, I turned my attention to the budget process, comparing divisional spending before and during the pandemic. After the provincial government ditched vehicle sticker fees, I also looked at the hypothetical revenue potential of a resurrected vehicle registration tax (VRT):
The annual VRT would be enough to pay for the annual capital budget for Road Safety ($14 million), Cycling Infrastructure ($16 million) and Sidewalk repair ($16 million) combined — twice. You could double the capital budget for all of them and it would be entirely covered by revenue from the tax.
Alternatively, the VRT could cover 53% of the cost of rehabbing the Gardiner, freeing up funds to go to other areas.
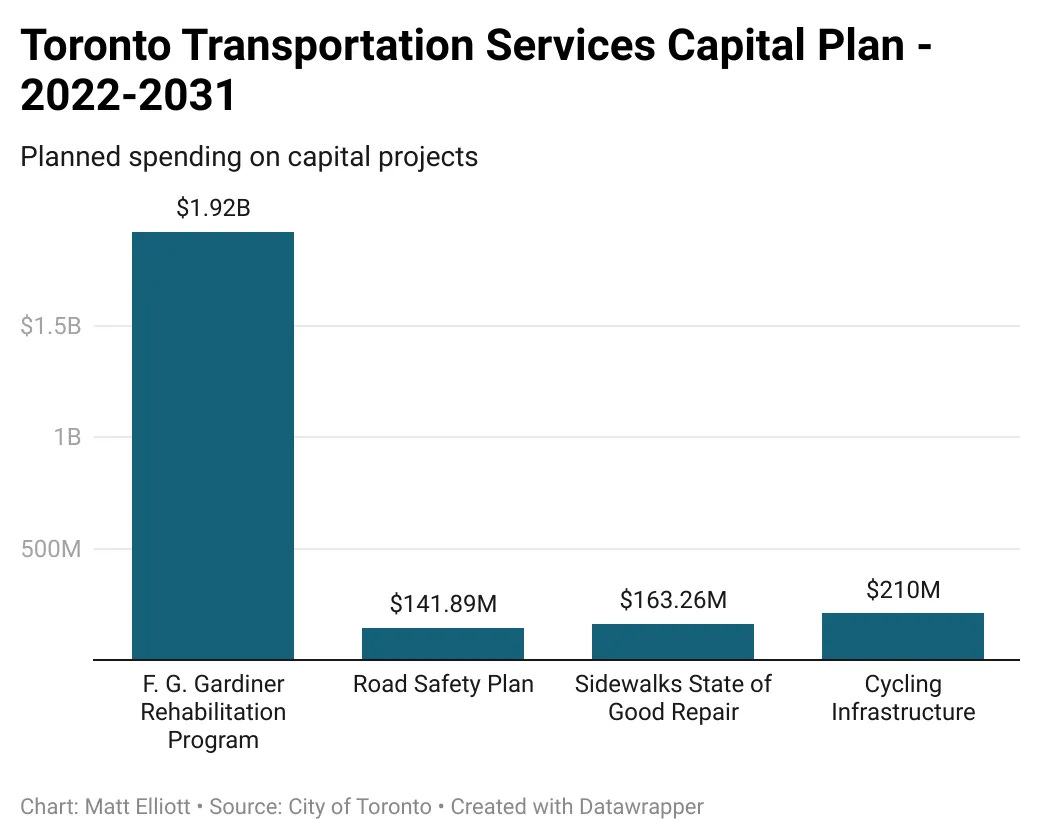
But the most captivating chart was the simple bar chart above, comparing the cost of rebuilding our lakeside expressway with other pertinent spending lines. It really can’t be overemphasized that this highway is very expensive.
March
Lobbyist Watch in March dove into the choppy waters of lobbying efforts around swimming pool sharing. And the Council Scorecard also made its first appearance of 2022.
Meanwhile, I attempted to use data to predict which Council incumbents were most at risk of losing their seats in the fall election. It was an experiment, and a pretty successful one. I ranked both Councillor Frances Nunziata, who came very close to losing her seat, and Councillor Mark Grimes, who lost his, in the top ten for most-vulnerable incumbents.
The month closed with the triumphant return of Neville Park, who talked to Bianca Wylie about Toronto’s tech troubles.
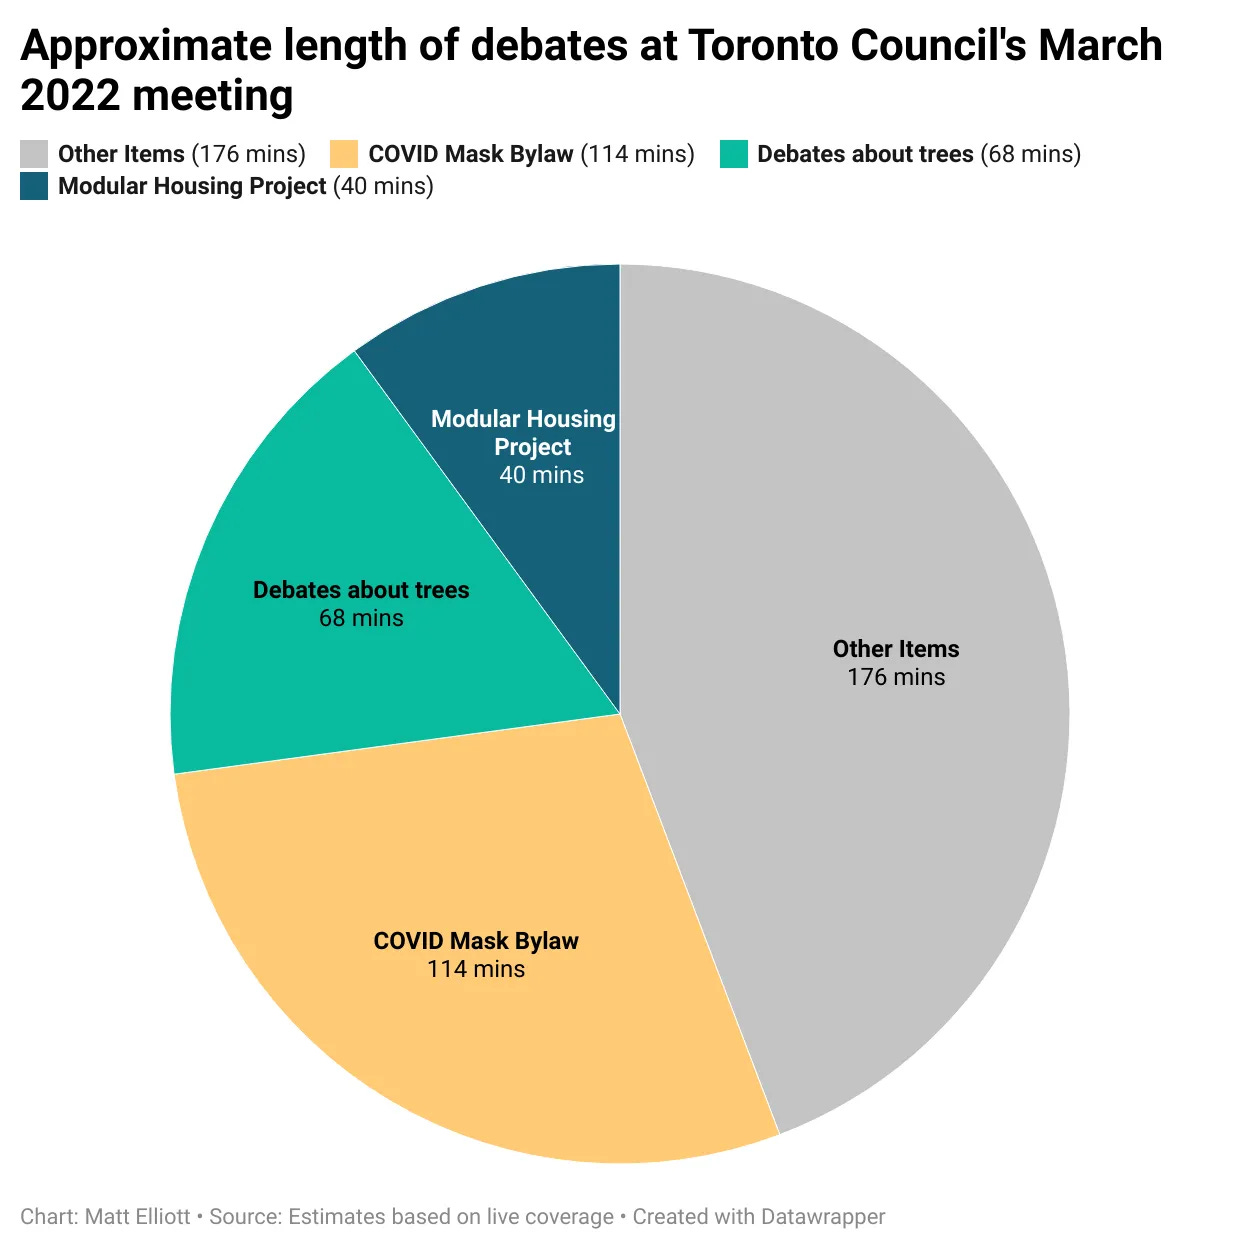
Good stuff, but, really, the highlight was undoubtedly a pie chart about tree debates — these are two of my favourite things.
April
Spring sprung with a new Lobbyist Watch with some tidbits about Smart Centres. I then uncovered that some fast food franchises and payday loan stores are getting tax breaks under the City’s new small business property tax class. And I used data to make a list of Toronto’s most dangerous streets.
The map above was my favourite, though, looking at the most common 311 complaints by ward. I’m not sure what’s funnier: Wildlife cadavers topping the list in Beaches-East York or zoning being the most common complaint in Spadina-Fort York.
May
It was gonna be May. Lobbyist Watch tried to get a handle on a strange proposal for a floating hotel on the waterfront. Council hired more security guards for parks, while also opting not to legalize having a beer in parks. Go figure.
A new edition of the Council Scorecard looked at retiring councillors, after Joe Cressy shocked the municipal world with his sudden departure. And the first Intersection Inspection of 2022 paid a visit to Queen East & Woodbine.
Chart-wise, I did some analysis of the cost of providing supportive housing to every person deemed chronically homeless in Toronto. It’s… not that much, relatively.
June
Lobbyist Watch was the first to report some strange lobbying activity from Blue Jays President & CEO Mark Shapiro. We later learned that Shapiro had signed a letter asking the City to cancel the ActiveTO program on Lake Shore West.
Even later — after Shapiro’s lobbying and a subsequent Council debate on ActiveTO led to an Integrity Commissioner complaint about Mayor John Tory involving himself in the debate, given his relationship with the Rogers corporation — we’d learn Councillor Mark Grimes wrote the letter Shapiro signed.
What a tangled web. But we didn’t know any of that at the time. So I previewed the Council debate and covered the outcome — bye-bye, ActiveTO.
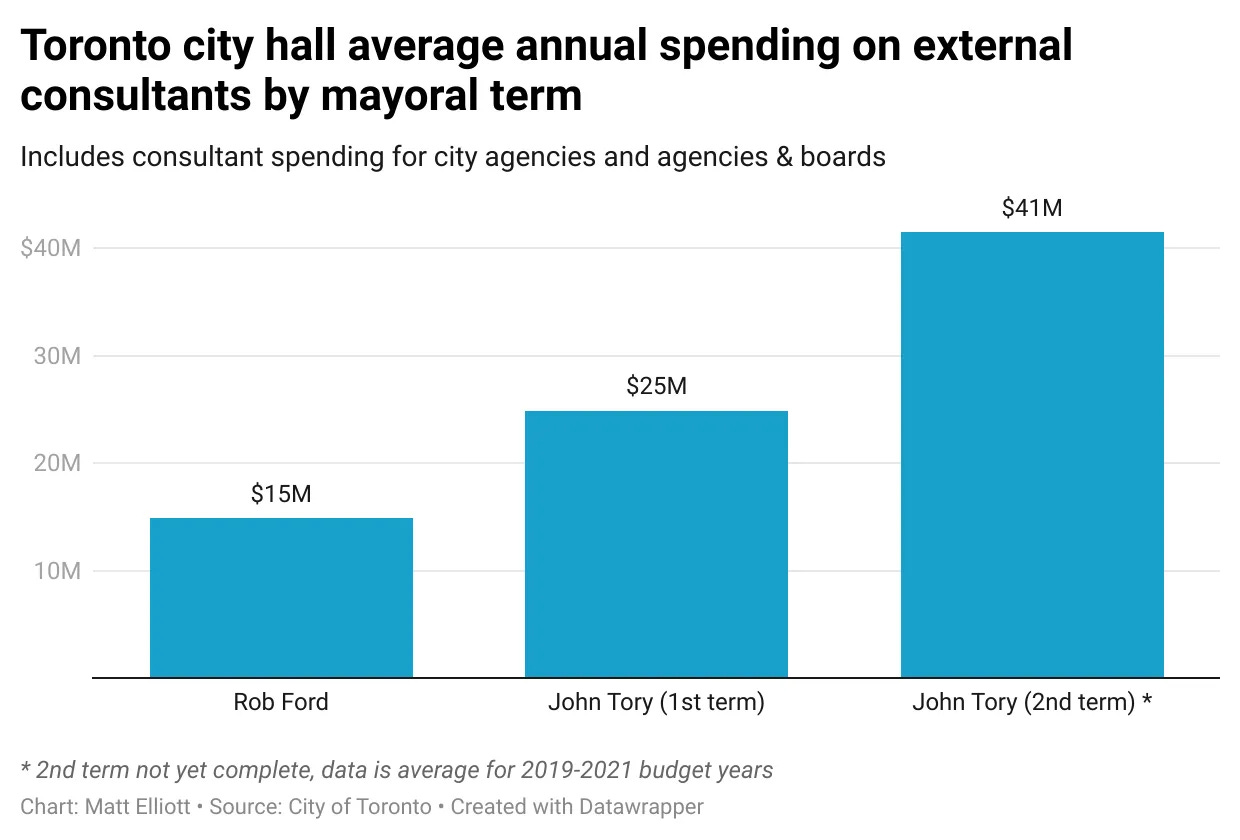
The month ended on another subject entirely, looking at the sharp rise in consulting expenses at City Hall over the last eight years.
July
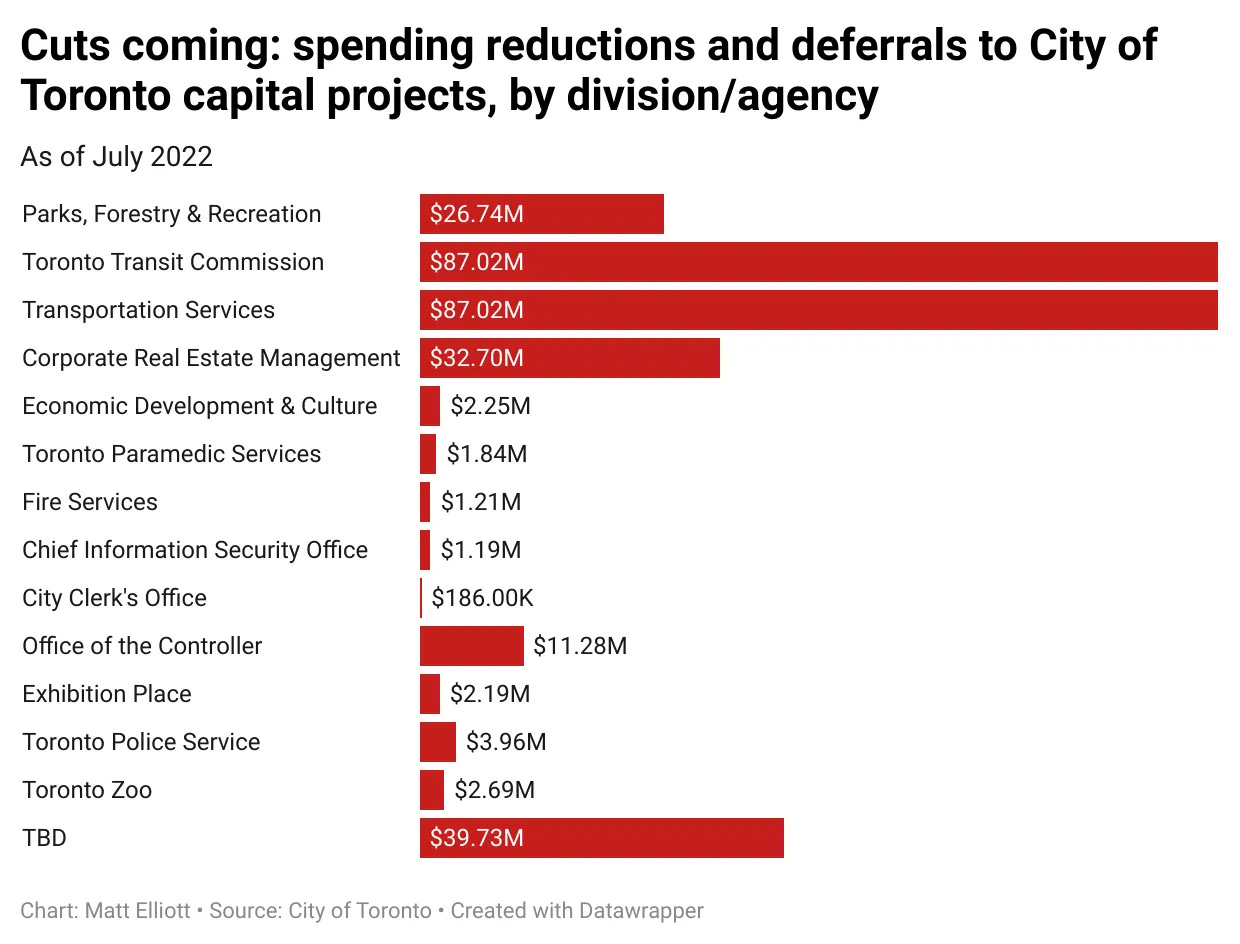
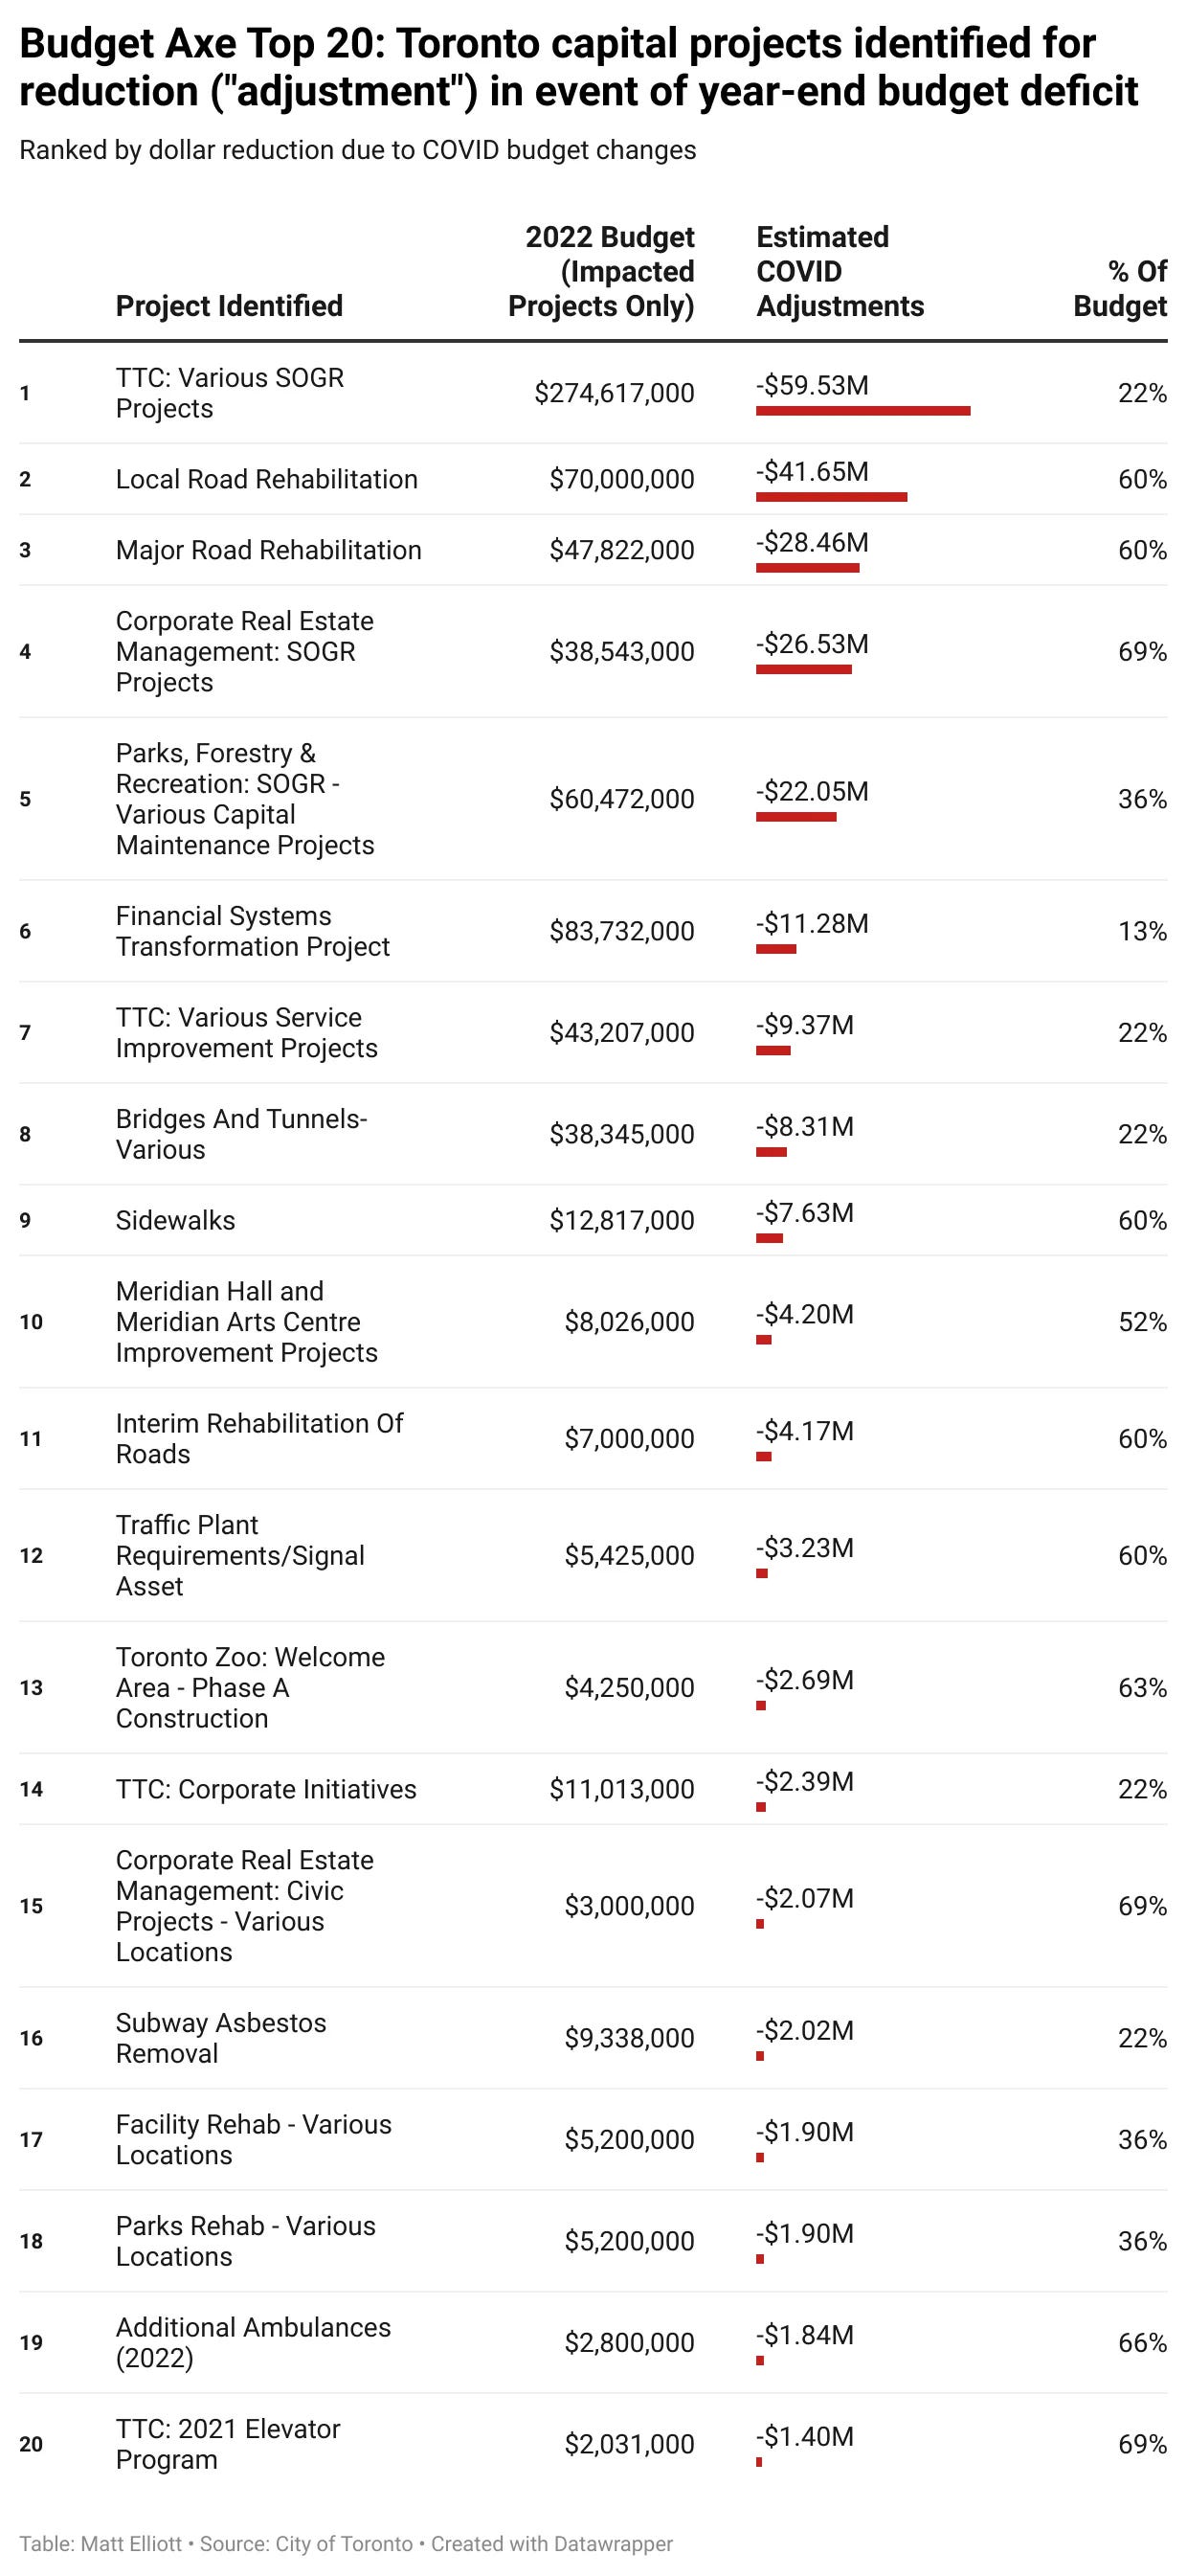
It was the summertime, but the living was not easy. The City started to get really nervous about the budget situation, to the point where we got a list of preliminary cuts to capital budgets for divisions, with TTC and Transportation facing the worst of it. The situation is still unresolved.
Meanwhile, Lobbyist Watch learned about some lobbying activity from a famous landscape architecture firm, and Neville Park returned with more tree journalism.
The month ended with a surprise twist: veto powers?! Well, that came out of nowhere.
August
The dog days of summer were still pretty busy. The August Lobbyist Watch began chronicling the movements of Therme Group, who won the right to build a spa/waterpark on the grounds of Ontario Place.
Later, the Council Scorecard for 2018-2022 was laid to rest, while an Intersection Inspection of Broadview & Danforth detailed some small mysteries about lunchtime pedestrian movements.
We also learned that Mayor John Tory, Councillor Mark Grimes and Deputy Mayor Denzil Minnan-Wong missed the most Council votes during the term, while Councillor Stephen Holyday voted against twice as many motions as the average councillor.
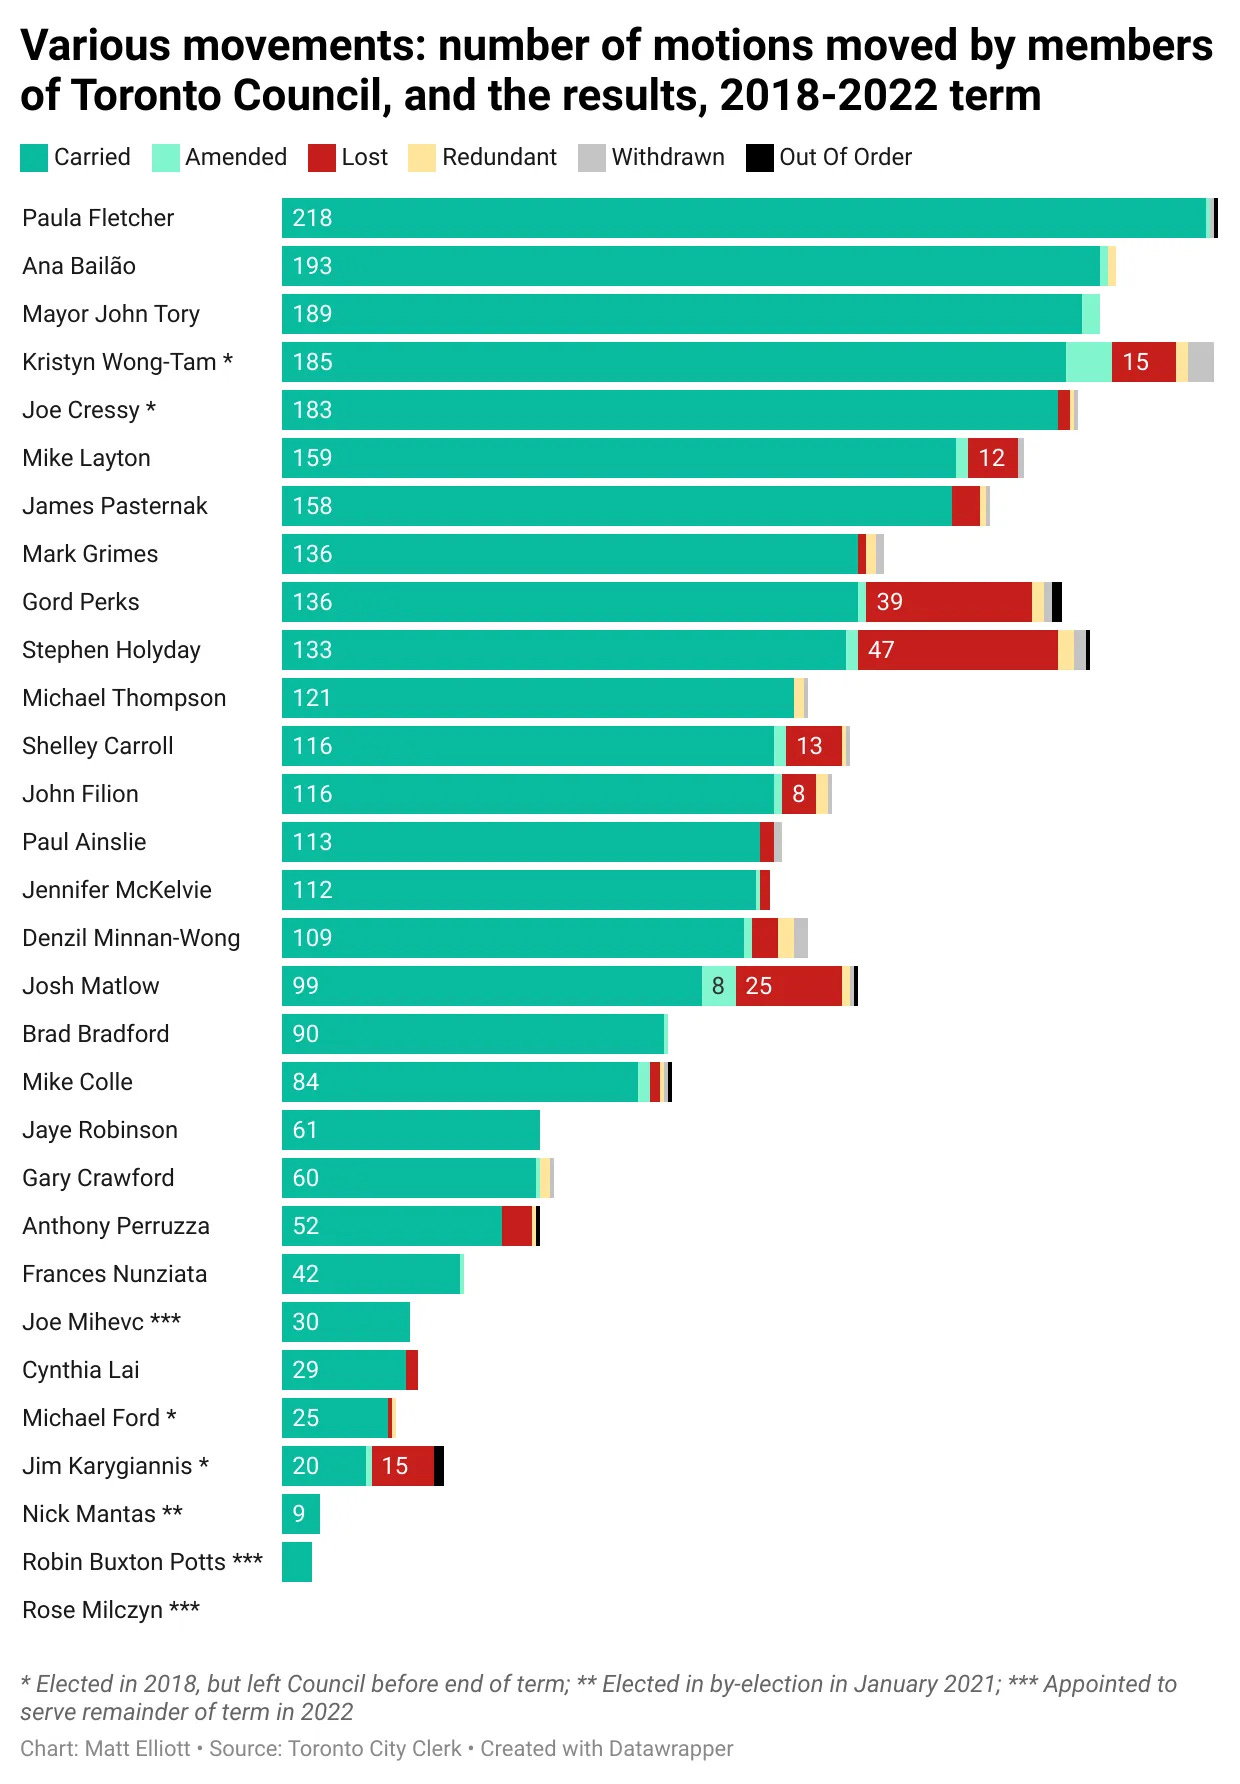
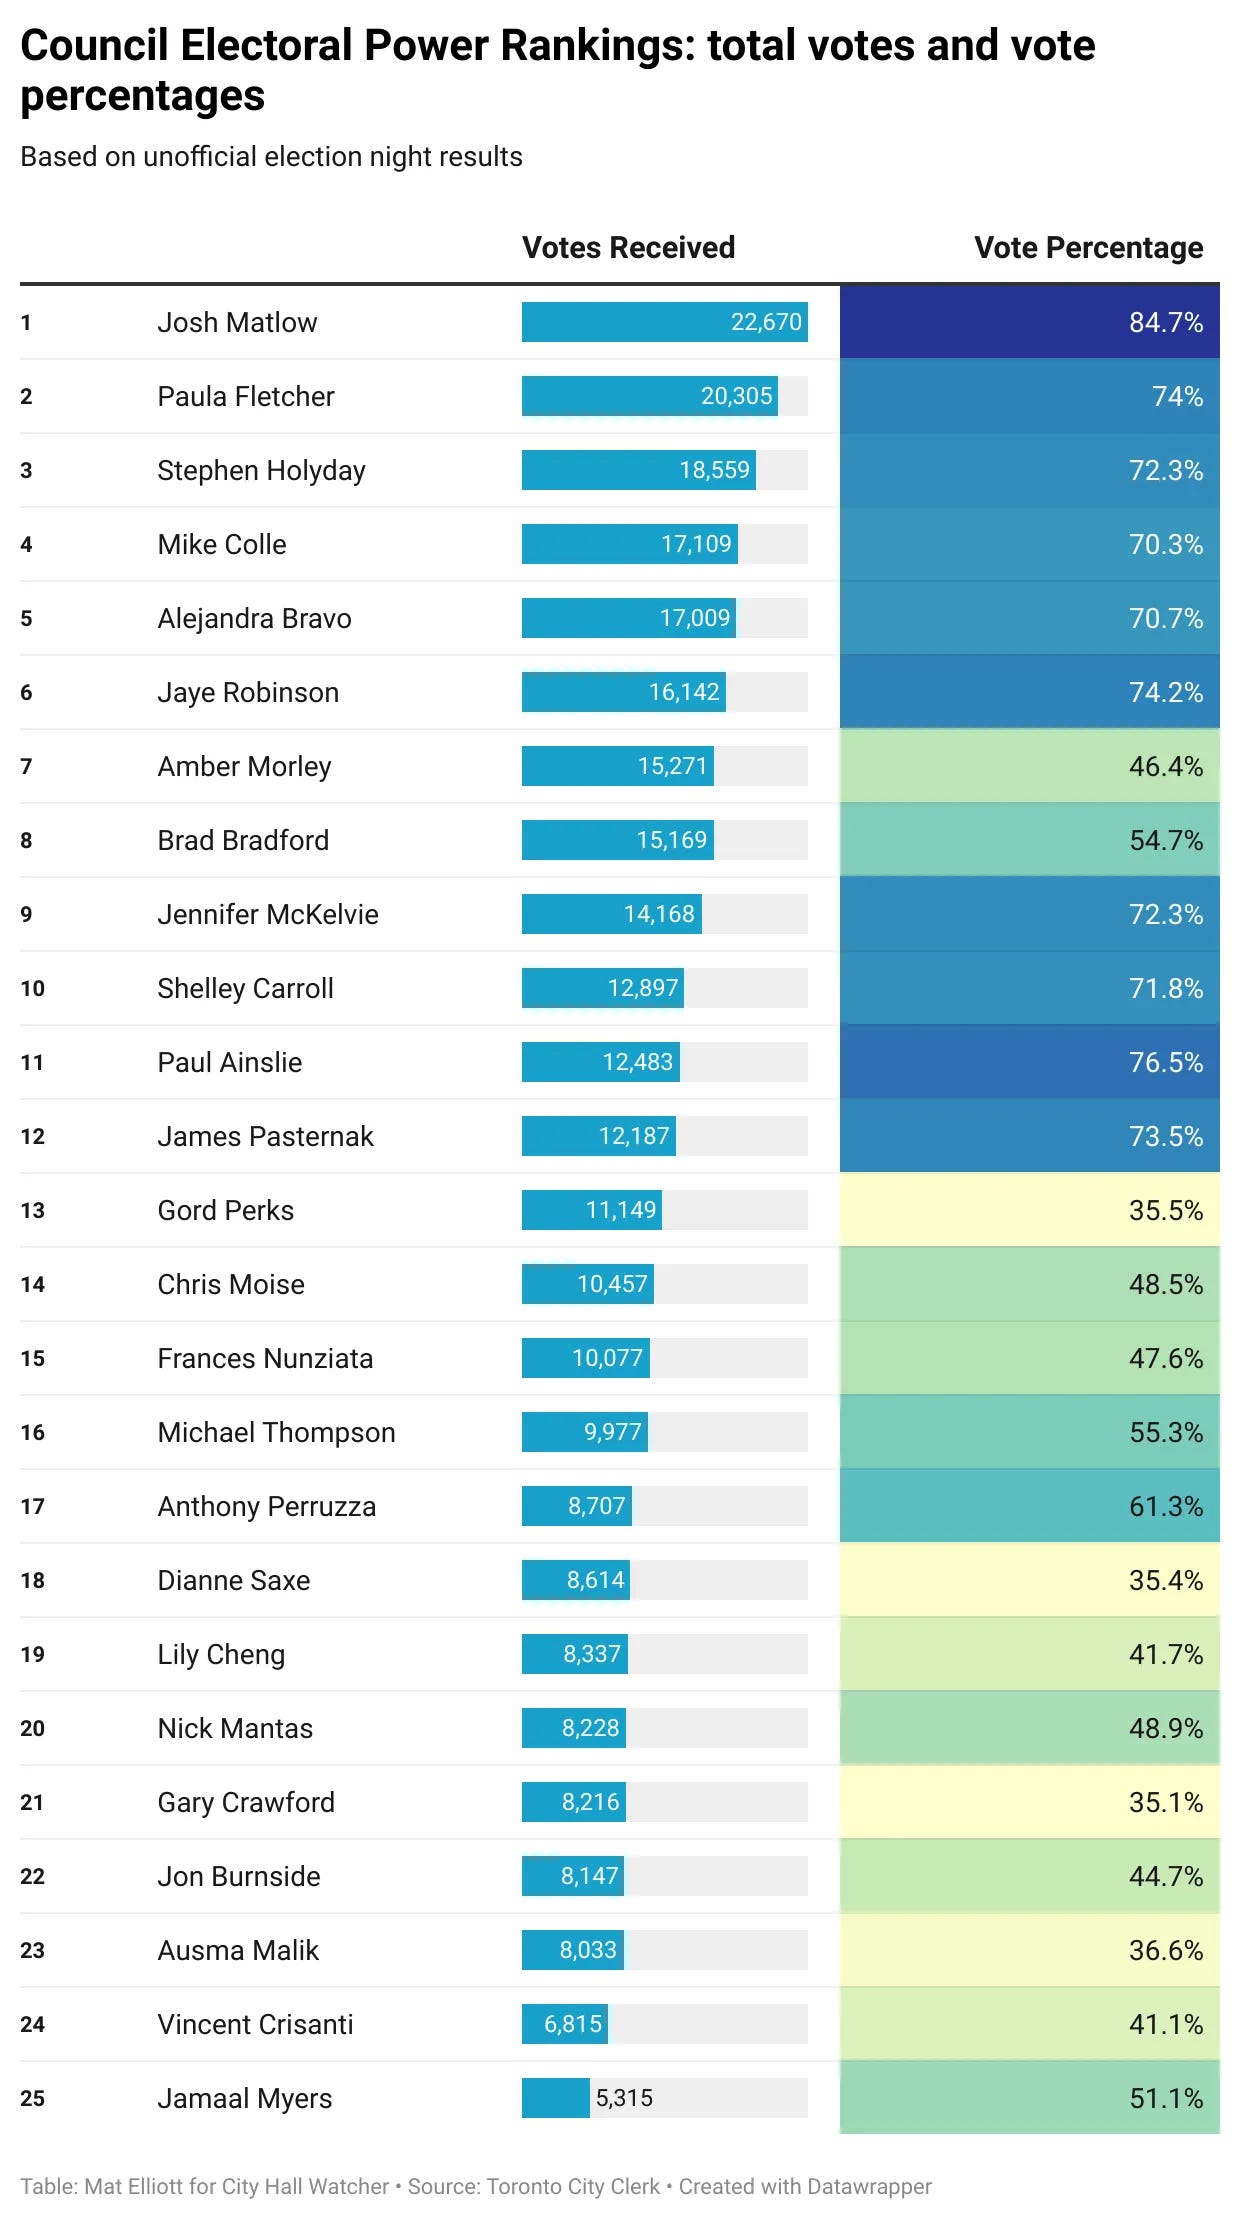
My favourite chart, though, came with the 2022 edition of the Council Power Rankings and looks at how successful and prolific members of Council were with their motions.
September
Back-to-school season saw former police officer Peter Sloly make his Lobbyist Watch debut. After that, City Hall Watcher’s election coverage ramped up, with a special guest post by Erin Wotherspoon looking at the trouble with turnout and the official launch of the Endorsement Matrix. Whoa.
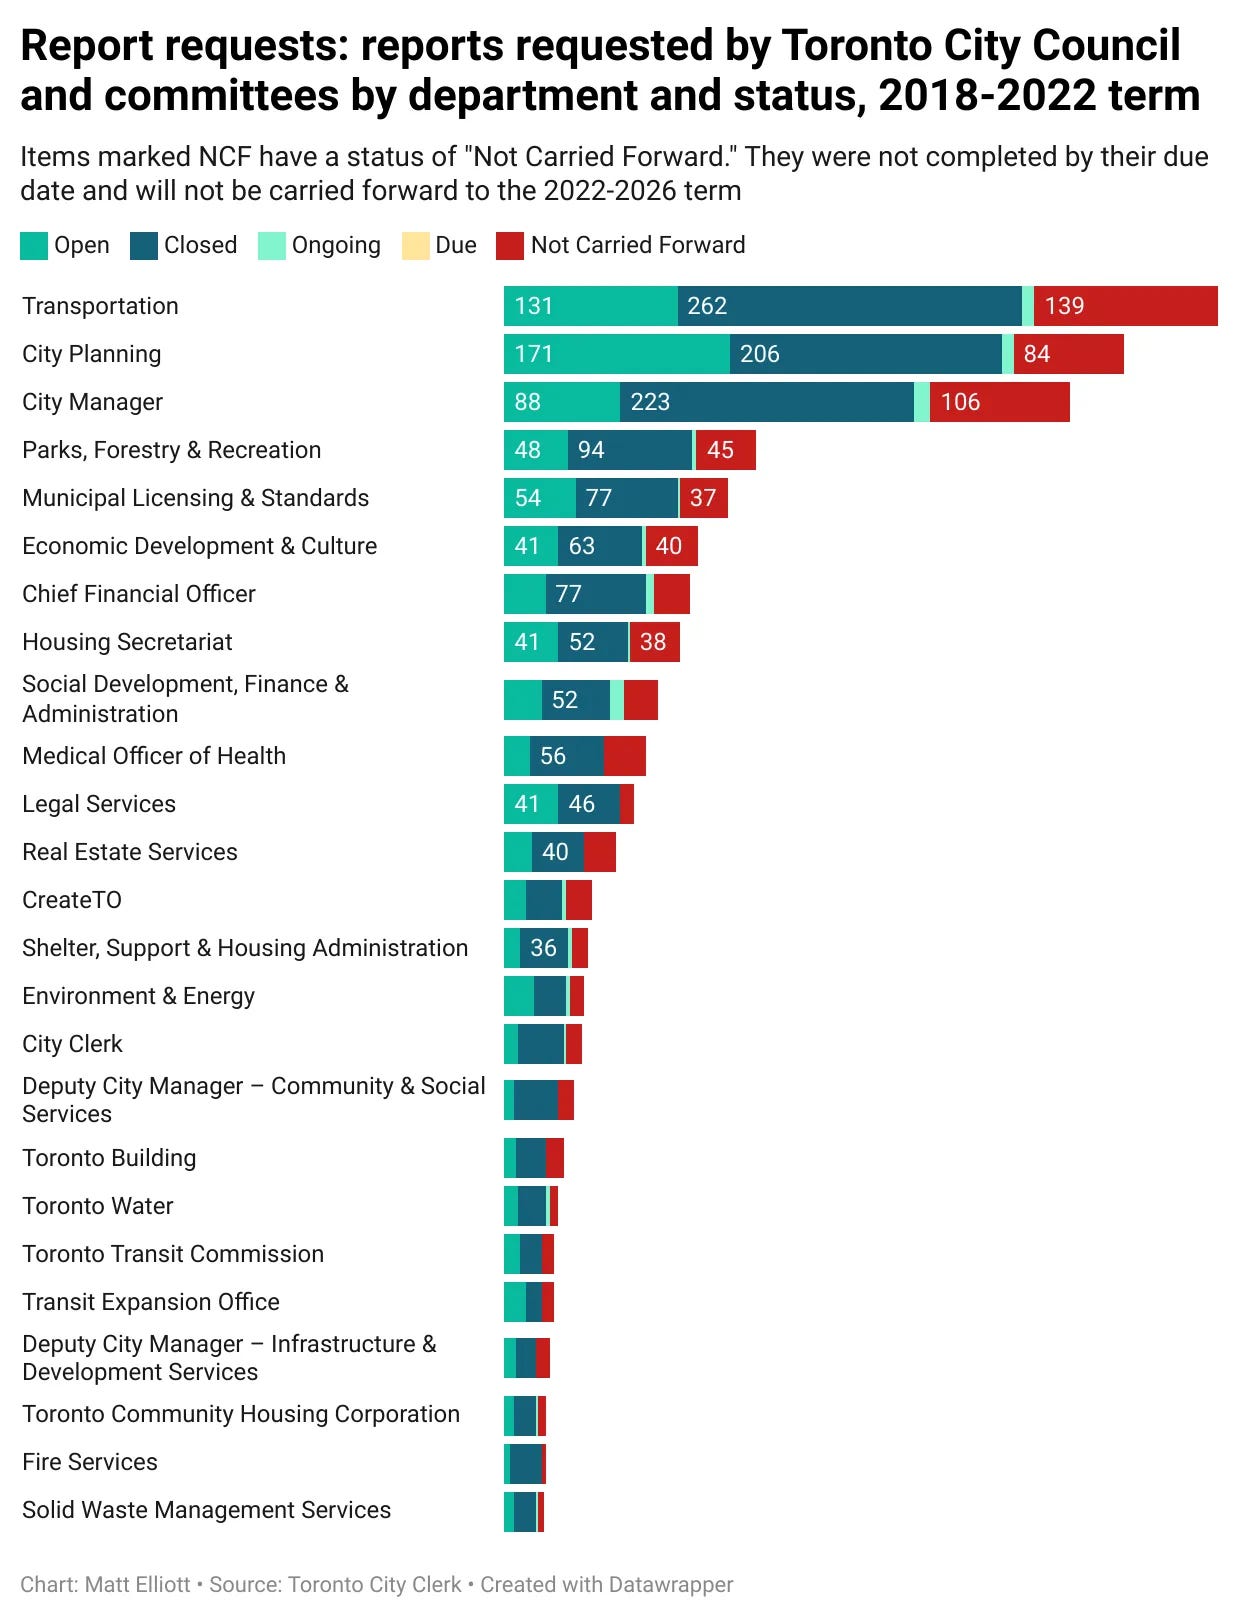
I also took a detailed look at the unfinished business of the Council term, as 1,174 report requests were quietly removed from the Council report backlog, never to be seen again.
October
An election happened! Remember that? In the aftermath, I spent a couple of weeks making way too many complicated charts.
Before the voting, Lobbyist Watch counted down the most prolific lobbyists of the term, and City Hall Watcher welcomed some pre-election guests. Spencer Kelly calculated what kind of development we’ll need to handle projected population growth, while Joy Connelly looked at the benefits of switching to an at-large electoral system.
November
There was no time to bask in the post-election afterglow.
City Hall Watcher celebrated 200 issues with an edition of Lobbyist Watch featuring hovercrafts, naturally. Then I previewed the first Council meeting of the term and took a close look at whether Council’s voting record on housing really justified strong mayor powers. The verdict? Not really.
I also embarked on a bizarre quest to find the John Toriest place in Toronto. For whatever it’s worth, I found it in Scarborough.
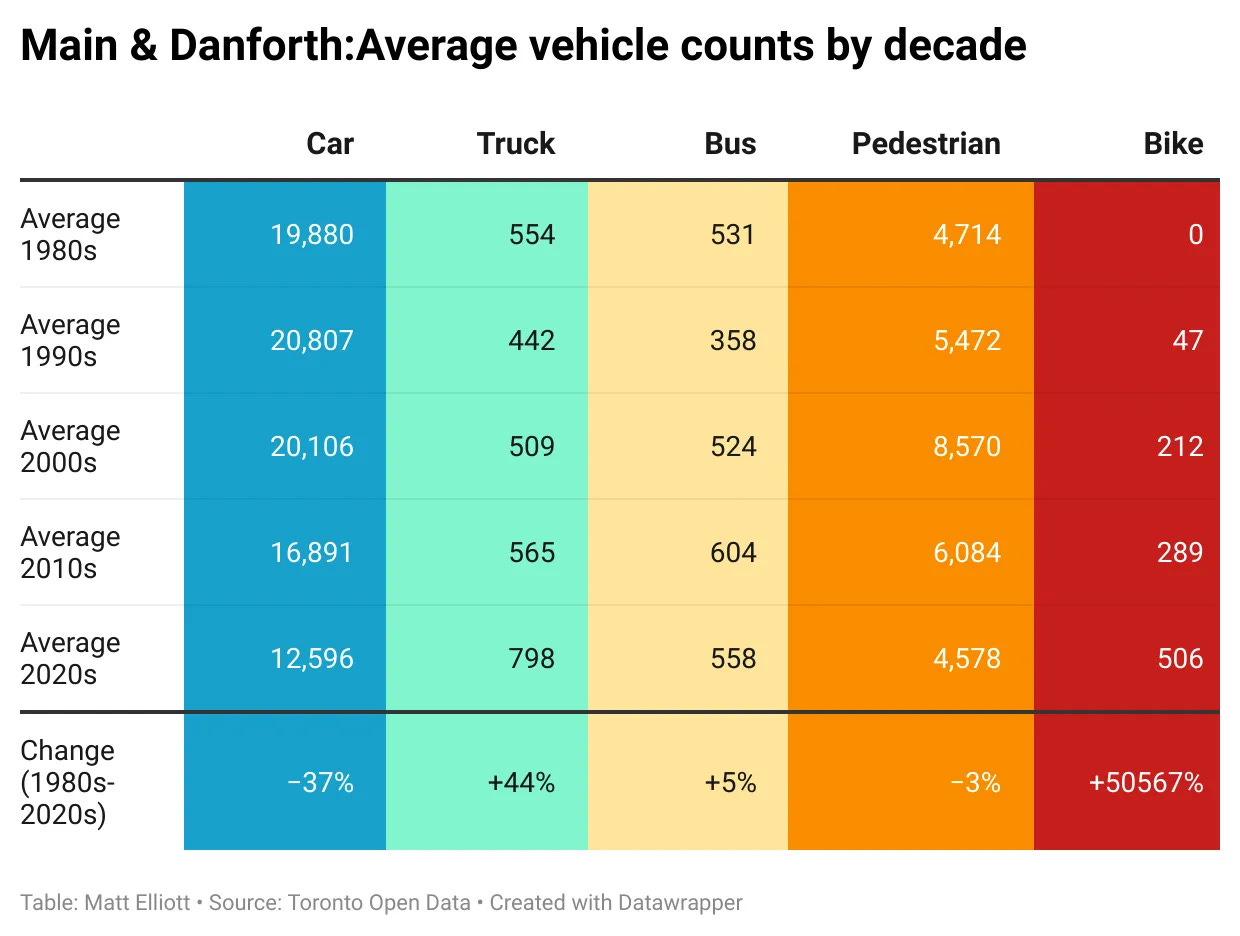
Most interesting for me, though, was an Intersection Inspection taking a look at the curious case of a right-turn lane at Main & Danforth. The data speaks for itself.
December
The year roared to its end with a whole lot of lobbying from Telus. I previewed and recapped the final Council meeting of the year, which was held under the shadow of a significant financial crisis forcing contemplation of deep cuts to capital projects.
Hold onto your hats, everyone. The budget is coming, and it doesn’t look good.
But don’t despair. City Hall Watcher will, at the very least, keep you informed. I’ll be back with a regular issue next Tuesday, January 3, to kick off another year of City Hall Watching. See you then.


